Drug response predict with scDrug
scDrug is a database that can be used to predict the drug sensitivity of single cells based on an existing database of drug responses. In the downstream tasks of single cell analysis, especially in tumours, we are fully interested in potential drugs and combination therapies. To this end, we have integrated scDrug’s IC50 prediction and inferCNV to infer the function of tumour cells to build a drug screening pipeline.
Paper: scDrug: From single-cell RNA-seq to drug response prediction
Code: https://github.com/ailabstw/scDrug
Colab_Reproducibility:https://colab.research.google.com/drive/1mayoMO7I7qjYIRjrZEi8r5zuERcxAEcF?usp=sharing
import omicverse as ov
import scanpy as sc
import infercnvpy as cnv
import matplotlib.pyplot as plt
import os

sc.settings.verbosity = 3             # verbosity: errors (0), warnings (1), info (2), hints (3)
sc.settings.set_figure_params(dpi=80, facecolor='white')
Infer the Tumor from scRNA-seq
Here we use Infercnvpy’s example data to complete the tumour analysis, you can also refer to the official tutorial for this step: https://infercnvpy.readthedocs.io/en/latest/notebooks/tutorial_3k.html
So, we provide a utility function ov.utils.get_gene_annotation to supplement the coordinate information from GTF files. The following usage assumes that the adata.var_names correspond to “gene_name” attribute in the GTF file. For other cases, please check the function documentation.
The GTF file used here can be downloaded from GENCODE.
T2T-CHM13 gtf file can be download from figshare
adata = cnv.datasets.maynard2020_3k()

ov.utils.get_gene_annotation(
    adata, gtf="gencode.v43.basic.annotation.gtf.gz",
    gtf_by="gene_name"
)
try downloading from url
https://github.com/icbi-lab/infercnvpy/releases/download/d0.1.0/maynard2020_3k.h5ad
... this may take a while but only happens once
| ensg | chromosome | start | end | |
|---|---|---|---|---|
| symbol | ||||
| AL645933.5 | ENSG00000288587.1 | chr6 | 31400702 | 31463705 |
| AC010184.1 | ENSG00000288585.1 | chr3 | 141449745 | 141456434 |
| AC023296.1 | ENSG00000288580.1 | chr8 | 2923568 | 2926689 |
| AL117334.2 | ENSG00000288577.1 | chr20 | 3406380 | 3410036 |
| AC107294.4 | ENSG00000288576.1 | chr3 | 184778723 | 184780720 |
adata=adata[:,~adata.var['chrom'].isnull()]
adata.var['chromosome']=adata.var['chrom']
adata.var['start']=adata.var['chromStart']
adata.var['end']=adata.var['chromEnd']
adata.var['ensg']=adata.var['gene_id']
adata.var.loc[:, ["ensg", "chromosome", "start", "end"]].head()
We noted that infercnvpy need to normalize and log the matrix at first
adata
AnnData object with n_obs × n_vars = 3000 × 55556
    obs: 'age', 'sex', 'sample', 'patient', 'cell_type'
    var: 'ensg', 'mito', 'n_cells_by_counts', 'mean_counts', 'pct_dropout_by_counts', 'total_counts', 'n_counts', 'chromosome', 'start', 'end', 'gene_id', 'gene_name'
    uns: 'cell_type_colors', 'neighbors', 'umap'
    obsm: 'X_scVI', 'X_umap'
    obsp: 'connectivities', 'distances'
We use the immune cells as reference and infer the cnv score of each cells in scRNA-seq
# We provide all immune cell types as "normal cells".
cnv.tl.infercnv(
    adata,
    reference_key="cell_type",
    reference_cat=[
        "B cell",
        "Macrophage",
        "Mast cell",
        "Monocyte",
        "NK cell",
        "Plasma cell",
        "T cell CD4",
        "T cell CD8",
        "T cell regulatory",
        "mDC",
        "pDC",
    ],
    window_size=250,
)
cnv.tl.pca(adata)
cnv.pp.neighbors(adata)
cnv.tl.leiden(adata)
cnv.tl.umap(adata)
cnv.tl.cnv_score(adata)
computing PCA
    with n_comps=50
    finished (0:00:00)
computing neighbors
    finished: added to `.uns['cnv_neighbors']`
    `.obsp['cnv_neighbors_distances']`, distances for each pair of neighbors
    `.obsp['cnv_neighbors_connectivities']`, weighted adjacency matrix (0:00:06)
running Leiden clustering
    finished: found 18 clusters and added
    'cnv_leiden', the cluster labels (adata.obs, categorical) (0:00:00)
computing UMAP
    finished: added
    'X_umap', UMAP coordinates (adata.obsm) (0:00:03)
sc.pl.umap(adata, color="cnv_score", show=False)
<AxesSubplot: title={'center': 'cnv_score'}, xlabel='UMAP1', ylabel='UMAP2'>
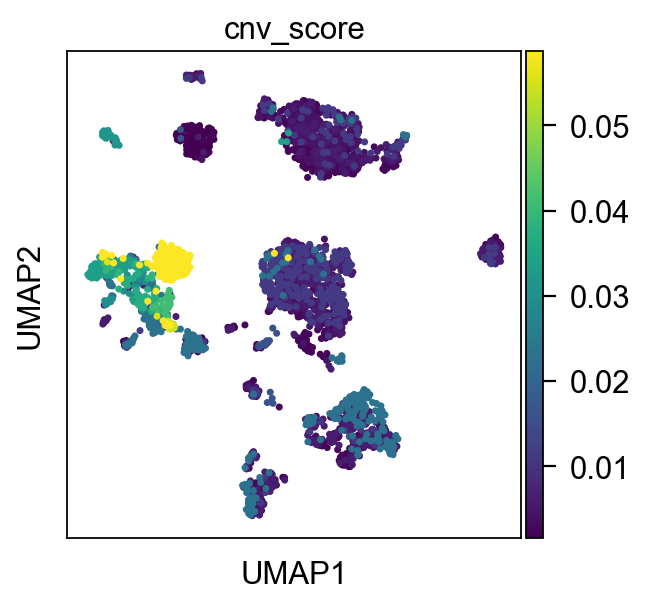
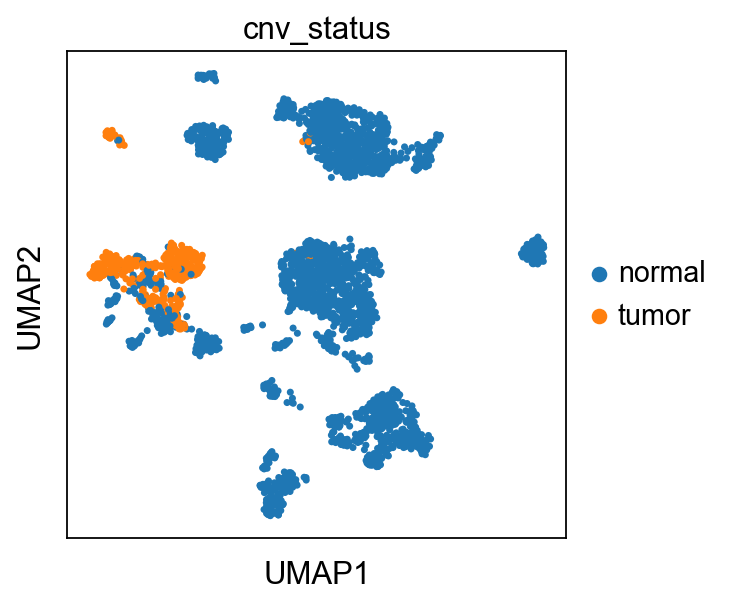
We set an appropriate threshold for the cnv_score, here we set it to 0.03 and identify cells greater than 0.03 as tumour cells
adata.obs["cnv_status"] = "normal"
adata.obs.loc[
    adata.obs["cnv_score"]>0.03, "cnv_status"
] = "tumor"
sc.pl.umap(adata, color="cnv_status", show=False)
<AxesSubplot: title={'center': 'cnv_status'}, xlabel='UMAP1', ylabel='UMAP2'>
We extracted tumour cells separately for drug prediction response
tumor=adata[adata.obs['cnv_status']=='tumor']
tumor.X.max()
ArrayView(13.09, dtype=float16)
Tumor preprocessing
We need to extract the highly variable genes in the tumour for further analysis, and found out the sub-cluster in tumor
adata=tumor
print('Preprocessing...')
sc.pp.filter_cells(adata, min_genes=200)
sc.pp.filter_genes(adata, min_cells=3)
adata.var['mt'] = adata.var_names.str.startswith('MT-')
sc.pp.calculate_qc_metrics(adata, qc_vars=['mt'], percent_top=None, log1p=False, inplace=True)
if not (adata.obs.pct_counts_mt == 0).all():
    adata = adata[adata.obs.pct_counts_mt < 30, :]

adata.raw = adata.copy()

sc.pp.highly_variable_genes(adata)
adata = adata[:, adata.var.highly_variable]
sc.pp.scale(adata)
sc.tl.pca(adata, svd_solver='arpack')
Preprocessing...
filtered out 27171 genes that are detected in less than 3 cells
extracting highly variable genes
    finished (0:00:00)
--> added
    'highly_variable', boolean vector (adata.var)
    'means', float vector (adata.var)
    'dispersions', float vector (adata.var)
    'dispersions_norm', float vector (adata.var)
computing PCA
    on highly variable genes
    with n_comps=50
    finished (0:00:00)
sc.pp.neighbors(adata, n_pcs=20)
sc.tl.umap(adata)
computing neighbors
    using 'X_pca' with n_pcs = 20
    finished: added to `.uns['neighbors']`
    `.obsp['distances']`, distances for each pair of neighbors
    `.obsp['connectivities']`, weighted adjacency matrix (0:00:00)
computing UMAP
    finished: added
    'X_umap', UMAP coordinates (adata.obsm) (0:00:00)
Here, we need to download the scDrug database and mods so that the subsequent predictions can be made properly
ov.utils.download_GDSC_data()
ov.utils.download_CaDRReS_model()
......GDSC data download start: masked_drugs
......Loading dataset from models/masked_drugs.csv
......GDSC data download start: GDSC_exp
......Loading dataset from models/GDSC_exp.tsv.gz
......GDSC data download finished!
......CaDRReS model download start: cadrres-wo-sample-bias_output_dict_all_genes
......Loading dataset from models/cadrres-wo-sample-bias_output_dict_all_genes.pickle
......CaDRReS model download start: cadrres-wo-sample-bias_output_dict_prism
......Loading dataset from models/cadrres-wo-sample-bias_output_dict_prism.pickle
......CaDRReS model download start: cadrres-wo-sample-bias_param_dict_all_genes
......Loading dataset from models/cadrres-wo-sample-bias_param_dict_all_genes.pickle
......CaDRReS model download start: cadrres-wo-sample-bias_param_dict_prism
......Loading dataset from models/cadrres-wo-sample-bias_param_dict_prism.pickle
......CaDRReS model download finished!
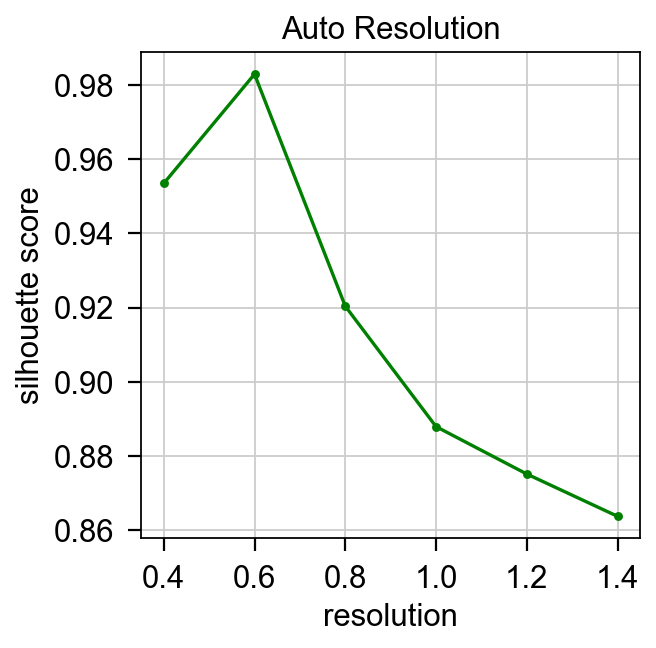
Then, we apply Single-Cell Data Analysis once again to carry out sub-clustering on the tumor clusters at automatically determined resolution.
adata, res,plot_df = ov.single.autoResolution(adata,cpus=4)
Automatically determine clustering resolution...
Clustering test: resolution =  0.4
running Louvain clustering
    using the "louvain" package of Traag (2017)
    finished: found 5 clusters and added
    'louvain', the cluster labels (adata.obs, categorical) (0:00:00)
running Louvain clustering
    using the "louvain" package of Traag (2017)
    finished: found 5 clusters and added
    'louvain', the cluster labels (adata.obs, categorical) (0:00:00)
running Louvain clustering
    using the "louvain" package of Traag (2017)
    finished: found 6 clusters and added
    'louvain', the cluster labels (adata.obs, categorical) (0:00:00)
running Louvain clustering
    using the "louvain" package of Traag (2017)
    finished: found 6 clusters and added
    'louvain', the cluster labels (adata.obs, categorical) (0:00:00)
running Louvain clustering
    using the "louvain" package of Traag (2017)
    finished: found 5 clusters and added
    'louvain', the cluster labels (adata.obs, categorical) (0:00:00)
running Louvain clustering
    using the "louvain" package of Traag (2017)
    finished: found 5 clusters and added
    'louvain_r0.4', the cluster labels (adata.obs, categorical) (0:00:00)
robustness score =  0.9534710380455399
time: {} 2.7343690395355225

Clustering test: resolution =  0.6
running Louvain clustering
    using the "louvain" package of Traag (2017)
    finished: found 6 clusters and added
    'louvain', the cluster labels (adata.obs, categorical) (0:00:00)
running Louvain clustering
    finished: found 6 clusters and added
    'louvain', the cluster labels (adata.obs, categorical) (0:00:00)
    using the "louvain" package of Traag (2017)
running Louvain clustering
    using the "louvain" package of Traag (2017)
    finished: found 6 clusters and added
    'louvain', the cluster labels (adata.obs, categorical) (0:00:00)
running Louvain clustering
    using the "louvain" package of Traag (2017)
    finished: found 6 clusters and added
    'louvain', the cluster labels (adata.obs, categorical) (0:00:00)
running Louvain clustering
    using the "louvain" package of Traag (2017)
    finished: found 6 clusters and added
    'louvain', the cluster labels (adata.obs, categorical) (0:00:00)
running Louvain clustering
    using the "louvain" package of Traag (2017)
    finished: found 6 clusters and added
    'louvain_r0.6', the cluster labels (adata.obs, categorical) (0:00:00)
robustness score =  0.9829131284843422
time: {} 1.7462828159332275

Clustering test: resolution =  0.8
running Louvain clustering
    using the "louvain" package of Traag (2017)
    finished: found 6 clusters and added
    'louvain', the cluster labels (adata.obs, categorical) (0:00:00)
running Louvain clustering
    using the "louvain" package of Traag (2017)
    finished: found 6 clusters and added
    'louvain', the cluster labels (adata.obs, categorical) (0:00:00)
running Louvain clustering
    using the "louvain" package of Traag (2017)
    finished: found 7 clusters and added
    'louvain', the cluster labels (adata.obs, categorical) (0:00:00)
running Louvain clustering
    using the "louvain" package of Traag (2017)
    finished: found 7 clusters and added
    'louvain', the cluster labels (adata.obs, categorical) (0:00:00)
running Louvain clustering
    using the "louvain" package of Traag (2017)
    finished: found 6 clusters and added
    'louvain', the cluster labels (adata.obs, categorical) (0:00:00)
running Louvain clustering
    using the "louvain" package of Traag (2017)
    finished: found 6 clusters and added
    'louvain_r0.8', the cluster labels (adata.obs, categorical) (0:00:00)
robustness score =  0.9203854037312804
time: {} 1.7291409969329834

Clustering test: resolution =  1.0
running Louvain clustering
    using the "louvain" package of Traag (2017)
    finished: found 8 clusters and added
    'louvain', the cluster labels (adata.obs, categorical) (0:00:00)
running Louvain clustering
    using the "louvain" package of Traag (2017)
    finished: found 8 clusters and added
    'louvain', the cluster labels (adata.obs, categorical) (0:00:00)
running Louvain clustering
    using the "louvain" package of Traag (2017)
    finished: found 8 clusters and added
    'louvain', the cluster labels (adata.obs, categorical) (0:00:00)
running Louvain clustering
    using the "louvain" package of Traag (2017)
    finished: found 8 clusters and added
    'louvain', the cluster labels (adata.obs, categorical) (0:00:00)
running Louvain clustering
    using the "louvain" package of Traag (2017)
    finished: found 8 clusters and added
    'louvain', the cluster labels (adata.obs, categorical) (0:00:00)
running Louvain clustering
    using the "louvain" package of Traag (2017)
    finished: found 8 clusters and added
    'louvain_r1.0', the cluster labels (adata.obs, categorical) (0:00:00)
robustness score =  0.8879266168983309
time: {} 1.7189157009124756

Clustering test: resolution =  1.2
running Louvain clustering
    using the "louvain" package of Traag (2017)
    finished: found 9 clusters and added
    'louvain', the cluster labels (adata.obs, categorical) (0:00:00)
running Louvain clustering
    using the "louvain" package of Traag (2017)
    finished: found 8 clusters and added
    'louvain', the cluster labels (adata.obs, categorical) (0:00:00)
running Louvain clustering
    using the "louvain" package of Traag (2017)
    finished: found 8 clusters and added
    'louvain', the cluster labels (adata.obs, categorical) (0:00:00)
running Louvain clustering
    using the "louvain" package of Traag (2017)
    finished: found 8 clusters and added
    'louvain', the cluster labels (adata.obs, categorical) (0:00:00)
running Louvain clustering
    using the "louvain" package of Traag (2017)
    finished: found 8 clusters and added
    'louvain', the cluster labels (adata.obs, categorical) (0:00:00)
running Louvain clustering
    using the "louvain" package of Traag (2017)
    finished: found 8 clusters and added
    'louvain_r1.2', the cluster labels (adata.obs, categorical) (0:00:00)
robustness score =  0.8751507489457891
time: {} 1.7845208644866943

Clustering test: resolution =  1.4
running Louvain clustering
    using the "louvain" package of Traag (2017)
    finished: found 8 clusters and added
    'louvain', the cluster labels (adata.obs, categorical) (0:00:00)
running Louvain clustering
    using the "louvain" package of Traag (2017)
    finished: found 8 clusters and added
    'louvain', the cluster labels (adata.obs, categorical) (0:00:00)
running Louvain clustering
    using the "louvain" package of Traag (2017)
    finished: found 8 clusters and added
    'louvain', the cluster labels (adata.obs, categorical) (0:00:00)
running Louvain clustering
    using the "louvain" package of Traag (2017)
    finished: found 8 clusters and added
    'louvain', the cluster labels (adata.obs, categorical) (0:00:00)
running Louvain clustering
    using the "louvain" package of Traag (2017)
    finished: found 8 clusters and added
    'louvain', the cluster labels (adata.obs, categorical) (0:00:00)
running Louvain clustering
    using the "louvain" package of Traag (2017)
    finished: found 8 clusters and added
    'louvain_r1.4', the cluster labels (adata.obs, categorical) (0:00:00)
robustness score =  0.8637485058403188
time: {} 1.850829839706421

resolution with highest score:  0.6
time: {} 11.607471227645874
Don’t forget to save your data
results_file = os.path.join('./', 'scanpyobj.h5ad')
adata.write(results_file)
results_file = os.path.join('./', 'scanpyobj.h5ad')
adata=sc.read(results_file)
IC50 predicted
Drug Response Prediction examined scanpyobj.h5ad generated in Single-Cell Data Analysis, reported clusterwise IC50 and cell death percentages to drugs in the GDSC database via CaDRReS-Sc (a recommender system framework for in silico drug response prediction), or drug sensitivity AUC in the PRISM database from DepMap Portal PRISM-19Q4.
Note we need to download the CaDRReS-Sc from github by git clone https://github.com/CSB5/CaDRReS-Sc
!git clone https://github.com/CSB5/CaDRReS-Sc
Cloning into 'CaDRReS-Sc'...
remote: Enumerating objects: 378, done.
remote: Counting objects: 100% (9/9), done.
remote: Compressing objects: 100% (8/8), done.
remote: Total 378 (delta 4), reused 5 (delta 1), pack-reused 369
Receiving objects: 100% (378/378), 48.76 MiB | 2.75 MiB/s, done.
Resolving deltas: 100% (156/156), done.
To run drug response predicted, we need to set:
scriptpath: the CaDRReS-Sc path we downloaded just now
modelpath: the model path we downloaded just now
output: the save path of drug response predicted result
import ov
job=ov.single.Drug_Response(adata,scriptpath='CaDRReS-Sc',
                                modelpath='models/',
                                output='result')
Calculating kernel features based on 13738 common genes
(28385, 6) (17419, 1018)
Predicting drug response for using CaDRReS(GDSC): cadrres-wo-sample-bias
done!
Ploting...
done!