Cell-cell communication using CellPhoneDBViz
Overview
Cell-cell communication (CCC) mediates complex biological processes, and its dysregulation is associated with disease development. With the rapid development of single-cell RNA sequencing (scRNA-seq) technologies, it is now possible to systematically analyze CCC at single-cell resolution.
CellPhoneDB is a publicly available repository of curated receptors, ligands and their interactions specifically in HUMAN. CellPhoneDB can be used to search for a particular ligand/receptor, or interrogate your own single-cell transcriptomics data to understand how the cells are communicating with each other.
Key Features of OmicVerse CellPhoneDB Integration
We have made three significant improvements in integrating the CellPhoneDB algorithm into OmicVerse:
Enhanced Data Handling: We provide comprehensive tutorials for analyzing any
AnnDataobject with automatic preprocessing and validationAdvanced Visualizations: We added modern heatmaps, chord diagrams and network plots for visualizing cell-cell relationships, similar to CellChat’s visualization capabilities
Comparative Analysis: We added visualization tools for comparing ligand-receptor proteins across different cell groups and conditions
Citation
Paper: Single-cell reconstruction of the early maternal–fetal interface in humans
Code: https://github.com/ventolab/CellphoneDB
CellChat Reference: Inference and analysis of cell-cell communication using CellChat
This notebook demonstrates how to use CellPhoneDB within the OmicVerse framework to analyze scRNA-seq data and create publication-ready visualizations similar to CellChat’s output.
import scanpy as sc
import omicverse as ov
import os

ov.plot_set()
#print(f'cellphonedb version{cellphonedb.__version__}')
🔬 Starting plot initialization...
🧬 Detecting CUDA devices…
✅ [GPU 0] NVIDIA H100 80GB HBM3
    • Total memory: 79.1 GB
    • Compute capability: 9.0

   ____            _     _    __
  / __ \____ ___  (_)___| |  / /__  _____________
 / / / / __ `__ \/ / ___/ | / / _ \/ ___/ ___/ _ \
/ /_/ / / / / / / / /__ | |/ /  __/ /  (__  )  __/
\____/_/ /_/ /_/_/\___/ |___/\___/_/  /____/\___/

🔖 Version: 1.7.2rc1   📚 Tutorials: https://omicverse.readthedocs.io/
✅ plot_set complete.
The EVT Data
Th EVT data have finished the celltype annotation, it can be download from the tutorial of CellPhoneDB.
Download: https://github.com/ventolab/CellphoneDB/blob/master/notebooks/data_tutorial.zip
adata=ov.read('data/cpdb/normalised_log_counts.h5ad')
adata=adata[adata.obs['cell_labels'].isin(['eEVT','iEVT','EVT_1','EVT_2','DC','dNK1','dNK2','dNK3',
                                          'VCT','VCT_CCC','VCT_fusing','VCT_p','GC','SCT'])]
adata
View of AnnData object with n_obs × n_vars = 1065 × 30800
    obs: 'n_genes', 'n_counts', 'cell_labels'
    var: 'gene_ids', 'feature_types'
    uns: 'neighbors_scVI_n_latent_14_sample_n_layers_3', 'neighbors_scVI_n_latent_20_sample_n_layers_3', 'umap'
    obsm: 'X_scVI_n_latent_14_sample_n_layers_3', 'X_scVI_n_latent_20_sample_n_layers_3', 'X_umap', 'X_umap_scVI_n_latent_14_sample_n_layers_3', 'X_umap_scVI_n_latent_20_sample_n_layers_3'
    obsp: 'neighbors_scVI_n_latent_14_sample_n_layers_3_connectivities', 'neighbors_scVI_n_latent_14_sample_n_layers_3_distances', 'neighbors_scVI_n_latent_20_sample_n_layers_3_connectivities', 'neighbors_scVI_n_latent_20_sample_n_layers_3_distances'
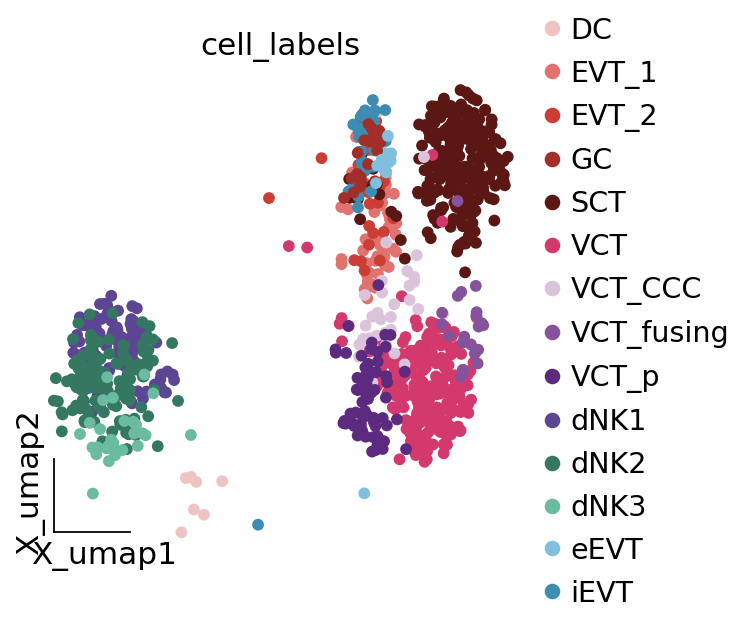
ov.pl.embedding(adata,
               basis='X_umap',
               color='cell_labels',
               frameon='small',
               palette=ov.pl.red_color+ov.pl.blue_color+ov.pl.green_color+ov.pl.orange_color+ov.pl.purple_color)
adata.X.max()
7.124379
We can clearly see that the maximum value of the data is a floating point number less than 10. The fact that the maximum value is not an integer means that it has been normalised, and the fact that it is less than 10 means that it has been logarithmised. Note that our data cannot be scaled.
Cell interaction analysis
Now, we can run ov.single.run_cellphonedb_v5 to analysis the default the cellphonedb.
cpdb_results, adata_cpdb = ov.single.run_cellphonedb_v5(
    adata,
    cpdb_file_path='./cellphonedb.zip',  # 必需参数
    celltype_key='cell_labels',
    min_cell_fraction=0.005,             # 细胞比例阈值
    min_genes=200,                       # 最小基因数
    min_cells=3,                         # 最小细胞数
    iterations=1000,                     # 置换次数
    threshold=0.1,                       # 表达阈值
    pvalue=0.05,                         # P值阈值
    threads=10,                          # 线程数
    output_dir='./cpdb_results',         # 输出目录
    cleanup_temp=True                    # 清理临时文件
)
🔬 Starting CellPhoneDB analysis...
❌ Database not found at: ./cellphonedb.zip
🔄 Attempting to download database...
📥 Downloading CellPhoneDB database...
   - Trying URL 1/2: https://github.com/ventolab/cellphonedb-data/raw/refs/heads/master/cellphonedb.zip
     Progress: 100.0%
✅ Successfully downloaded CellPhoneDB database to: cellphonedb.zip
   - Original data: 1065 cells, 30800 genes
   - Cell types passing 0.5% threshold: 14
   - Minimum cells required: 5
   - After filtering: 1065 cells, 30800 genes
filtered out 11158 genes that are detected in less than 3 cells
   - After preprocessing: 1065 cells, 19642 genes
   - Temporary directory: /tmp/cpdb_temp_x1kinimb
   - Output directory: ./cpdb_results
   - Created temporary input files
   - Running CellPhoneDB statistical analysis...
Reading user files...
The following user files were loaded successfully:
/tmp/cpdb_temp_x1kinimb/counts_matrix.h5ad
/tmp/cpdb_temp_x1kinimb/metadata.tsv
[ ][CORE][24/06/25-20:09:28][INFO] [Cluster Statistical Analysis] Threshold:0.1 Iterations:1000 Debug-seed:42 Threads:10 Precision:3
[ ][CORE][24/06/25-20:09:28][WARNING] Debug random seed enabled. Set to 42
[ ][CORE][24/06/25-20:09:30][INFO] Running Real Analysis
[ ][CORE][24/06/25-20:09:30][INFO] Running Statistical Analysis
[ ][CORE][24/06/25-20:09:41][INFO] Building Pvalues result
[ ][CORE][24/06/25-20:09:41][INFO] Building results
[ ][CORE][24/06/25-20:09:42][INFO] Scoring interactions: Filtering genes per cell type..
[ ][CORE][24/06/25-20:09:42][INFO] Scoring interactions: Calculating mean expression of each gene per group/cell type..
[ ][CORE][24/06/25-20:09:42][INFO] Scoring interactions: Calculating scores for all interactions and cell types..
Saved deconvoluted to ./cpdb_results/statistical_analysis_deconvoluted_06_24_2025_201004.txt
Saved deconvoluted_percents to ./cpdb_results/statistical_analysis_deconvoluted_percents_06_24_2025_201004.txt
Saved means to ./cpdb_results/statistical_analysis_means_06_24_2025_201004.txt
Saved pvalues to ./cpdb_results/statistical_analysis_pvalues_06_24_2025_201004.txt
Saved significant_means to ./cpdb_results/statistical_analysis_significant_means_06_24_2025_201004.txt
Saved interaction_scores to ./cpdb_results/statistical_analysis_interaction_scores_06_24_2025_201004.txt
   - CellPhoneDB analysis completed successfully!
   - Formatting results for visualization...
   - Found 13 info columns and 196 cell type pairs
   - Found 121 pathway classifications
   - Created visualization AnnData: (196, 1441)
   - Cell interactions: 196
   - L-R pairs: 1441
   - Cleaned up temporary directory: /tmp/cpdb_temp_x1kinimb
✅ CellPhoneDB analysis pipeline completed!
ov.utils.save(cpdb_results,'data/cpdb/gex_cpdb_test.pkl')
adata_cpdb.write('data/cpdb/gex_cpdb_ad.h5ad')
💾 Save Operation:
   Target path: data/cpdb/gex_cpdb_test.pkl
   Object type: dict
   Using: pickle
   ✅ Successfully saved!
────────────────────────────────────────────────────────────
cpdb_results=ov.utils.load('data/cpdb/gex_cpdb_test.pkl')
adata_cpdb=ov.read('data/cpdb/gex_cpdb_ad.h5ad')
📂 Load Operation:
   Source path: data/cpdb/gex_cpdb_test.pkl
   Using: pickle
   ✅ Successfully loaded!
   Loaded object type: dict
────────────────────────────────────────────────────────────
Visualize the result of CellPhoneDB look like CellChat
To visualize the cell-cell communication networks similar to CellChat, we first need to initialize the CellChatViz class. This visualization framework provides comprehensive tools for analyzing and presenting CellPhoneDB results using modern plotting approaches.
Initialize CellChatViz Object
The CellChatViz class requires the processed CellPhoneDB AnnData object and accepts an optional color palette for consistent cell type coloring across all visualizations.
color_dict=dict(zip(
    adata.obs['cell_labels'].cat.categories,
    adata.uns['cell_labels_colors']
))
viz = ov.pl.CellChatViz(adata_cpdb,palette=color_dict)
adata_cpdb
AnnData object with n_obs × n_vars = 196 × 1441
    obs: 'sender', 'receiver'
    var: 'id_cp_interaction', 'interacting_pair', 'partner_a', 'partner_b', 'gene_a', 'gene_b', 'secreted', 'receptor_a', 'receptor_b', 'annotation_strategy', 'is_integrin', 'directionality', 'classification', 'interaction_name'
    layers: 'means', 'pvalues'
Calculate the aggregated cell-cell communication network
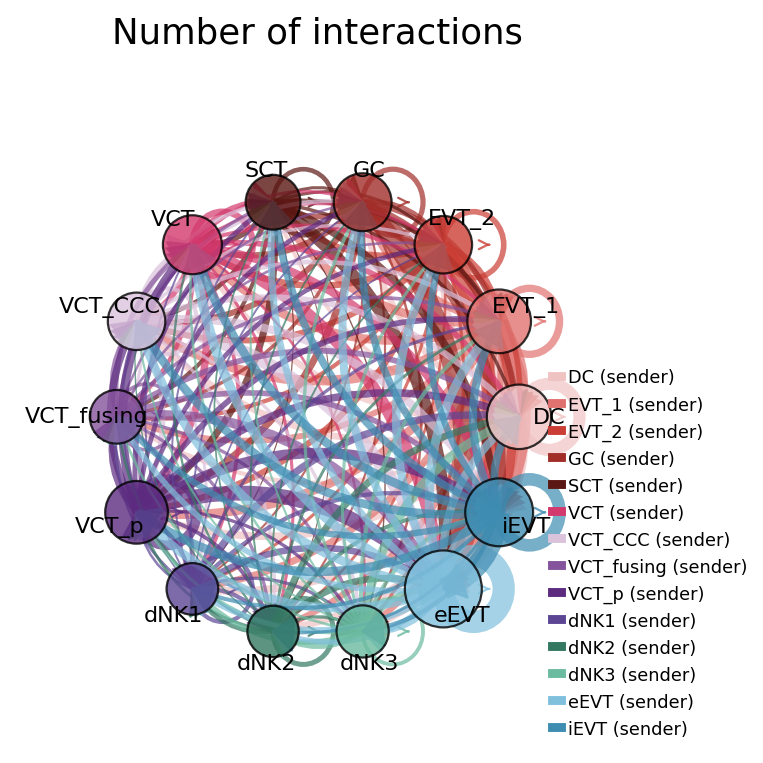
The aggregated cell-cell communication network provides a high-level overview of communication patterns between different cell types. We can visualize either the number of interactions (count) or the total interaction strength (weights) between any two cell groups using circle plots.
Understanding Aggregated Networks
Count Matrix: Shows the number of significant ligand-receptor pairs between cell types
Weight Matrix: Represents the cumulative interaction strength based on mean expression levels
These networks help identify the most communicatively active cell types and reveal dominant communication axes in your tissue or experimental system.
count_matrix, weight_matrix=viz.compute_aggregated_network(pvalue_threshold=0.05, use_means=True)
fig2, ax2 = viz.netVisual_circle(
    weight_matrix,
    title="Interaction weights/strength",
    cmap='Reds',
    vertex_size_max=10,
    figsize=(5, 5),
)
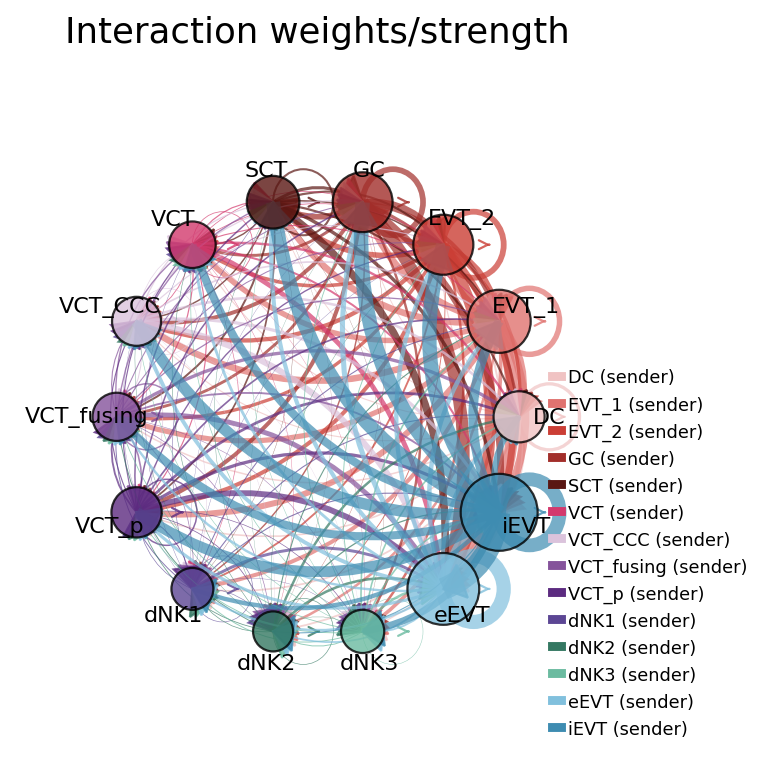
fig2, ax2 = viz.netVisual_circle(
    count_matrix,
    title="Number of interactions",
    cmap='Reds',
    vertex_size_max=10,
    figsize=(5, 5),
)
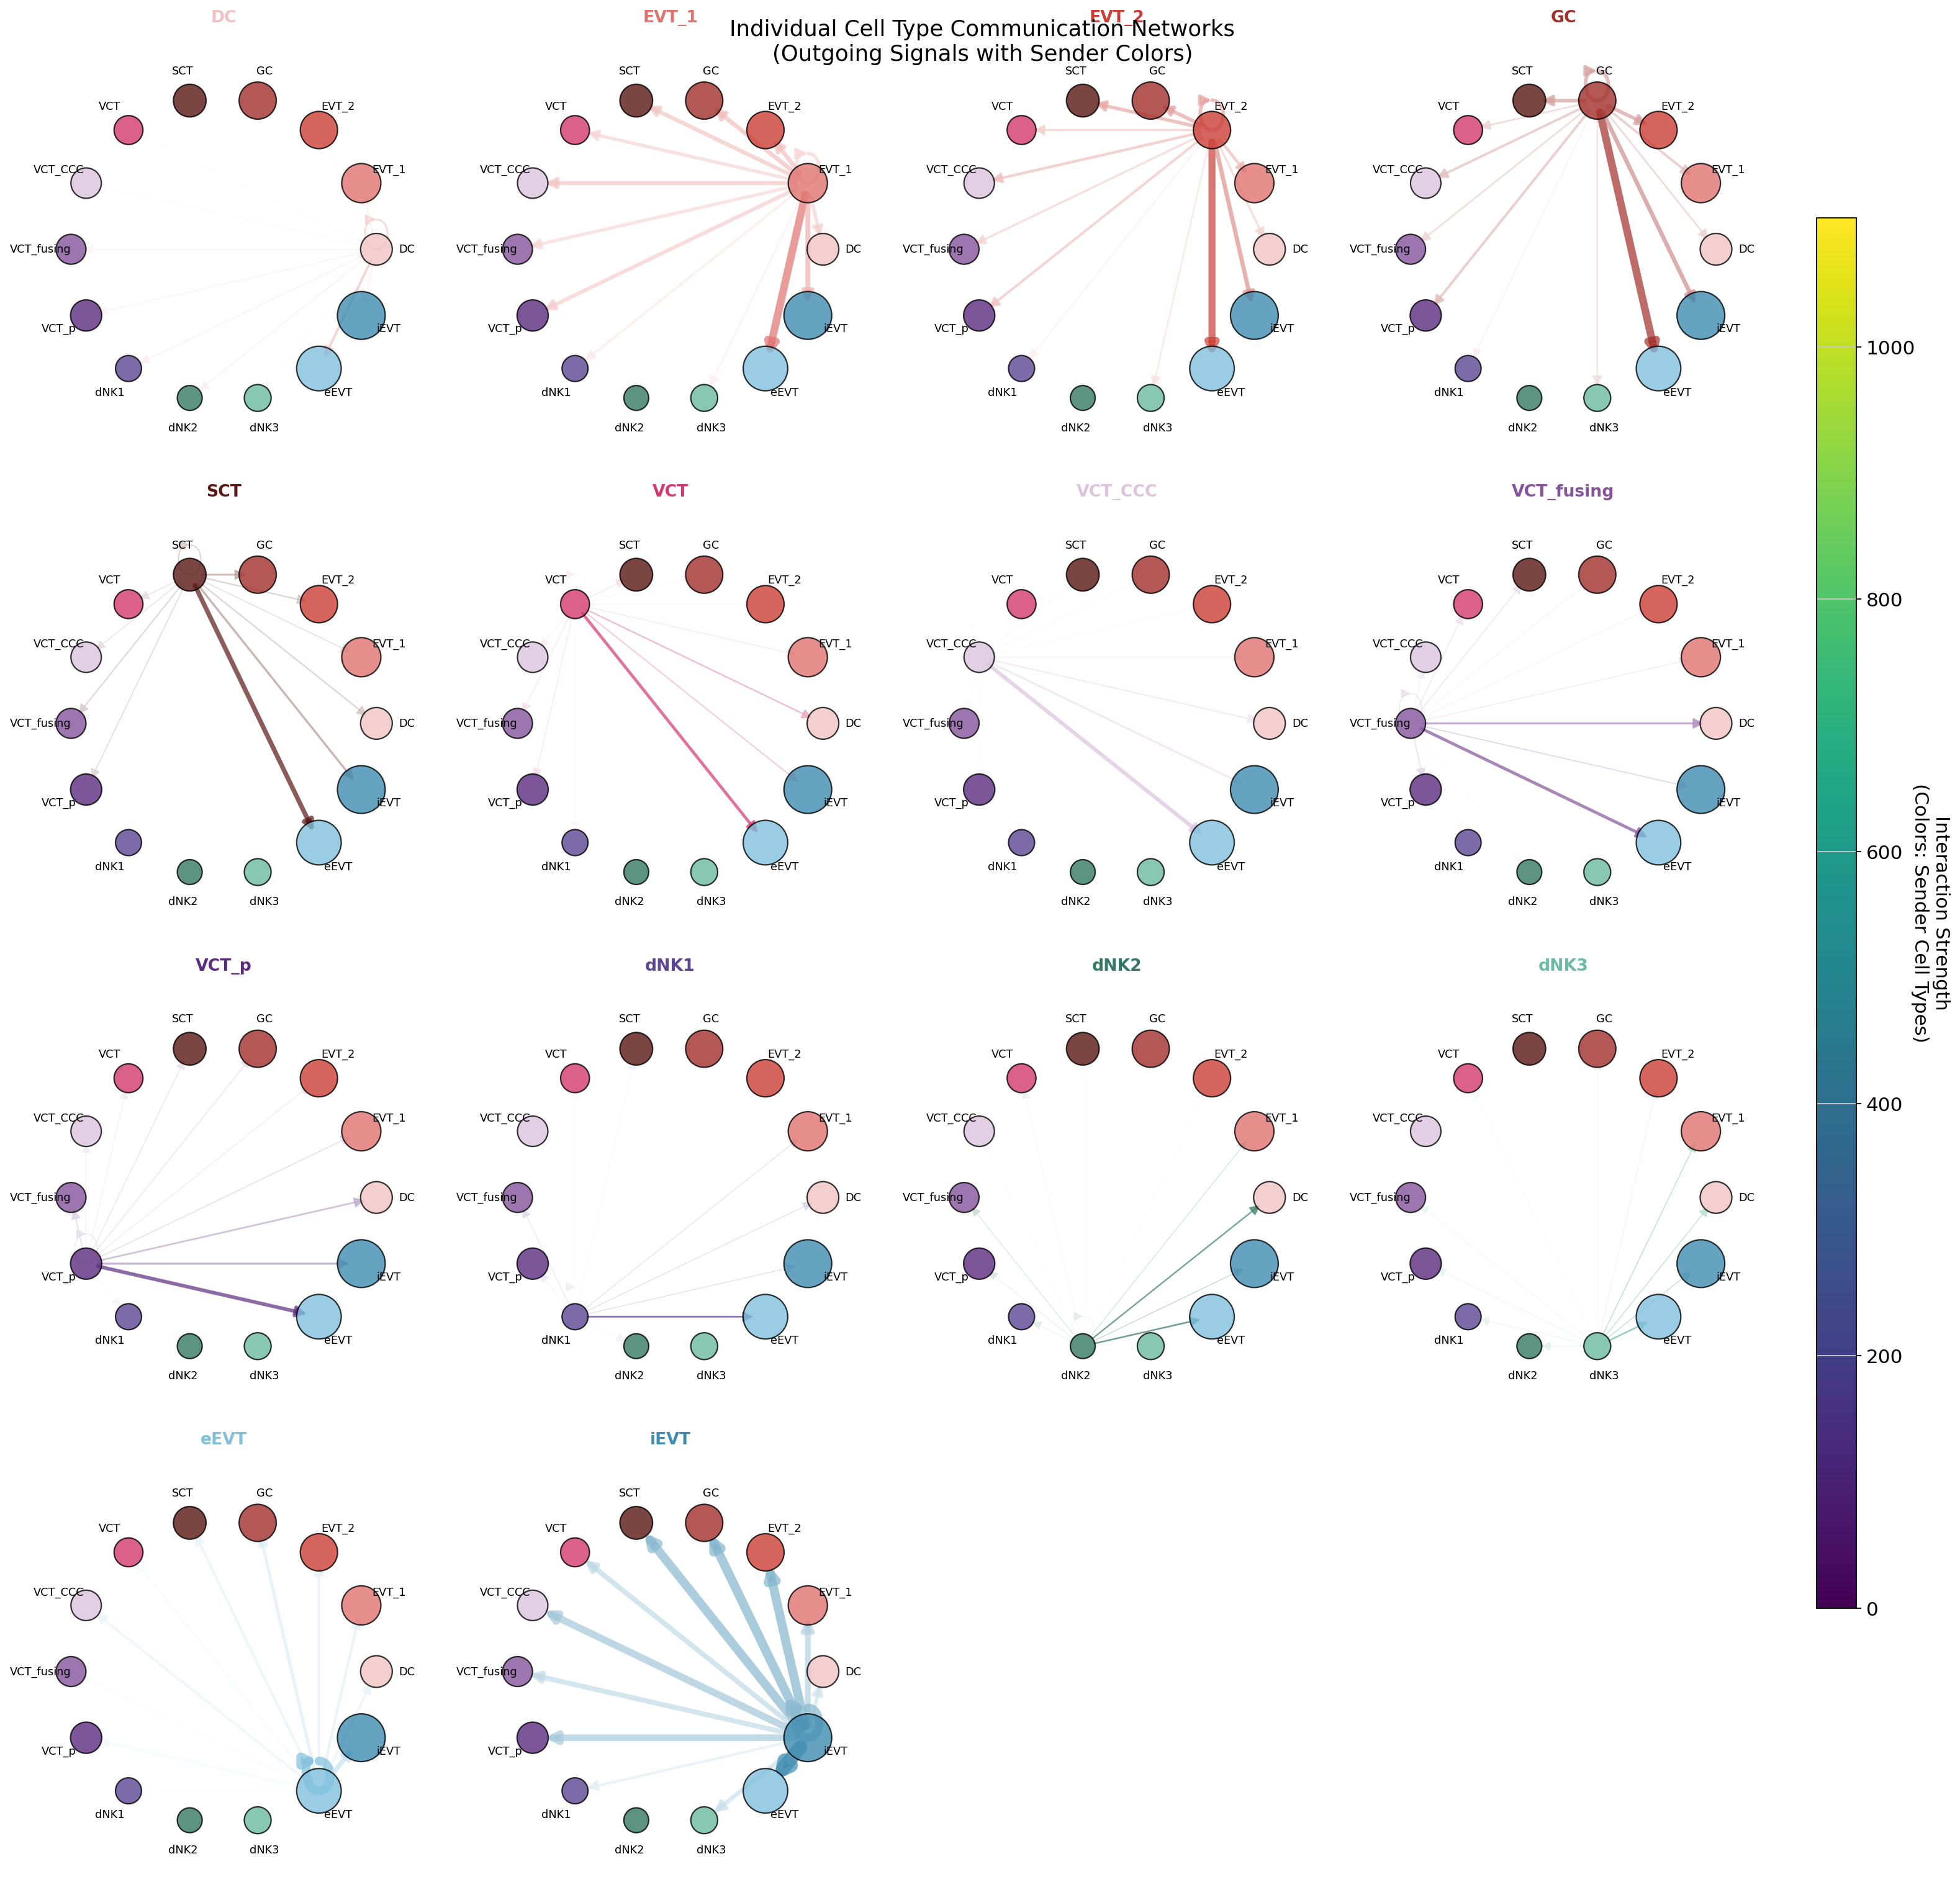
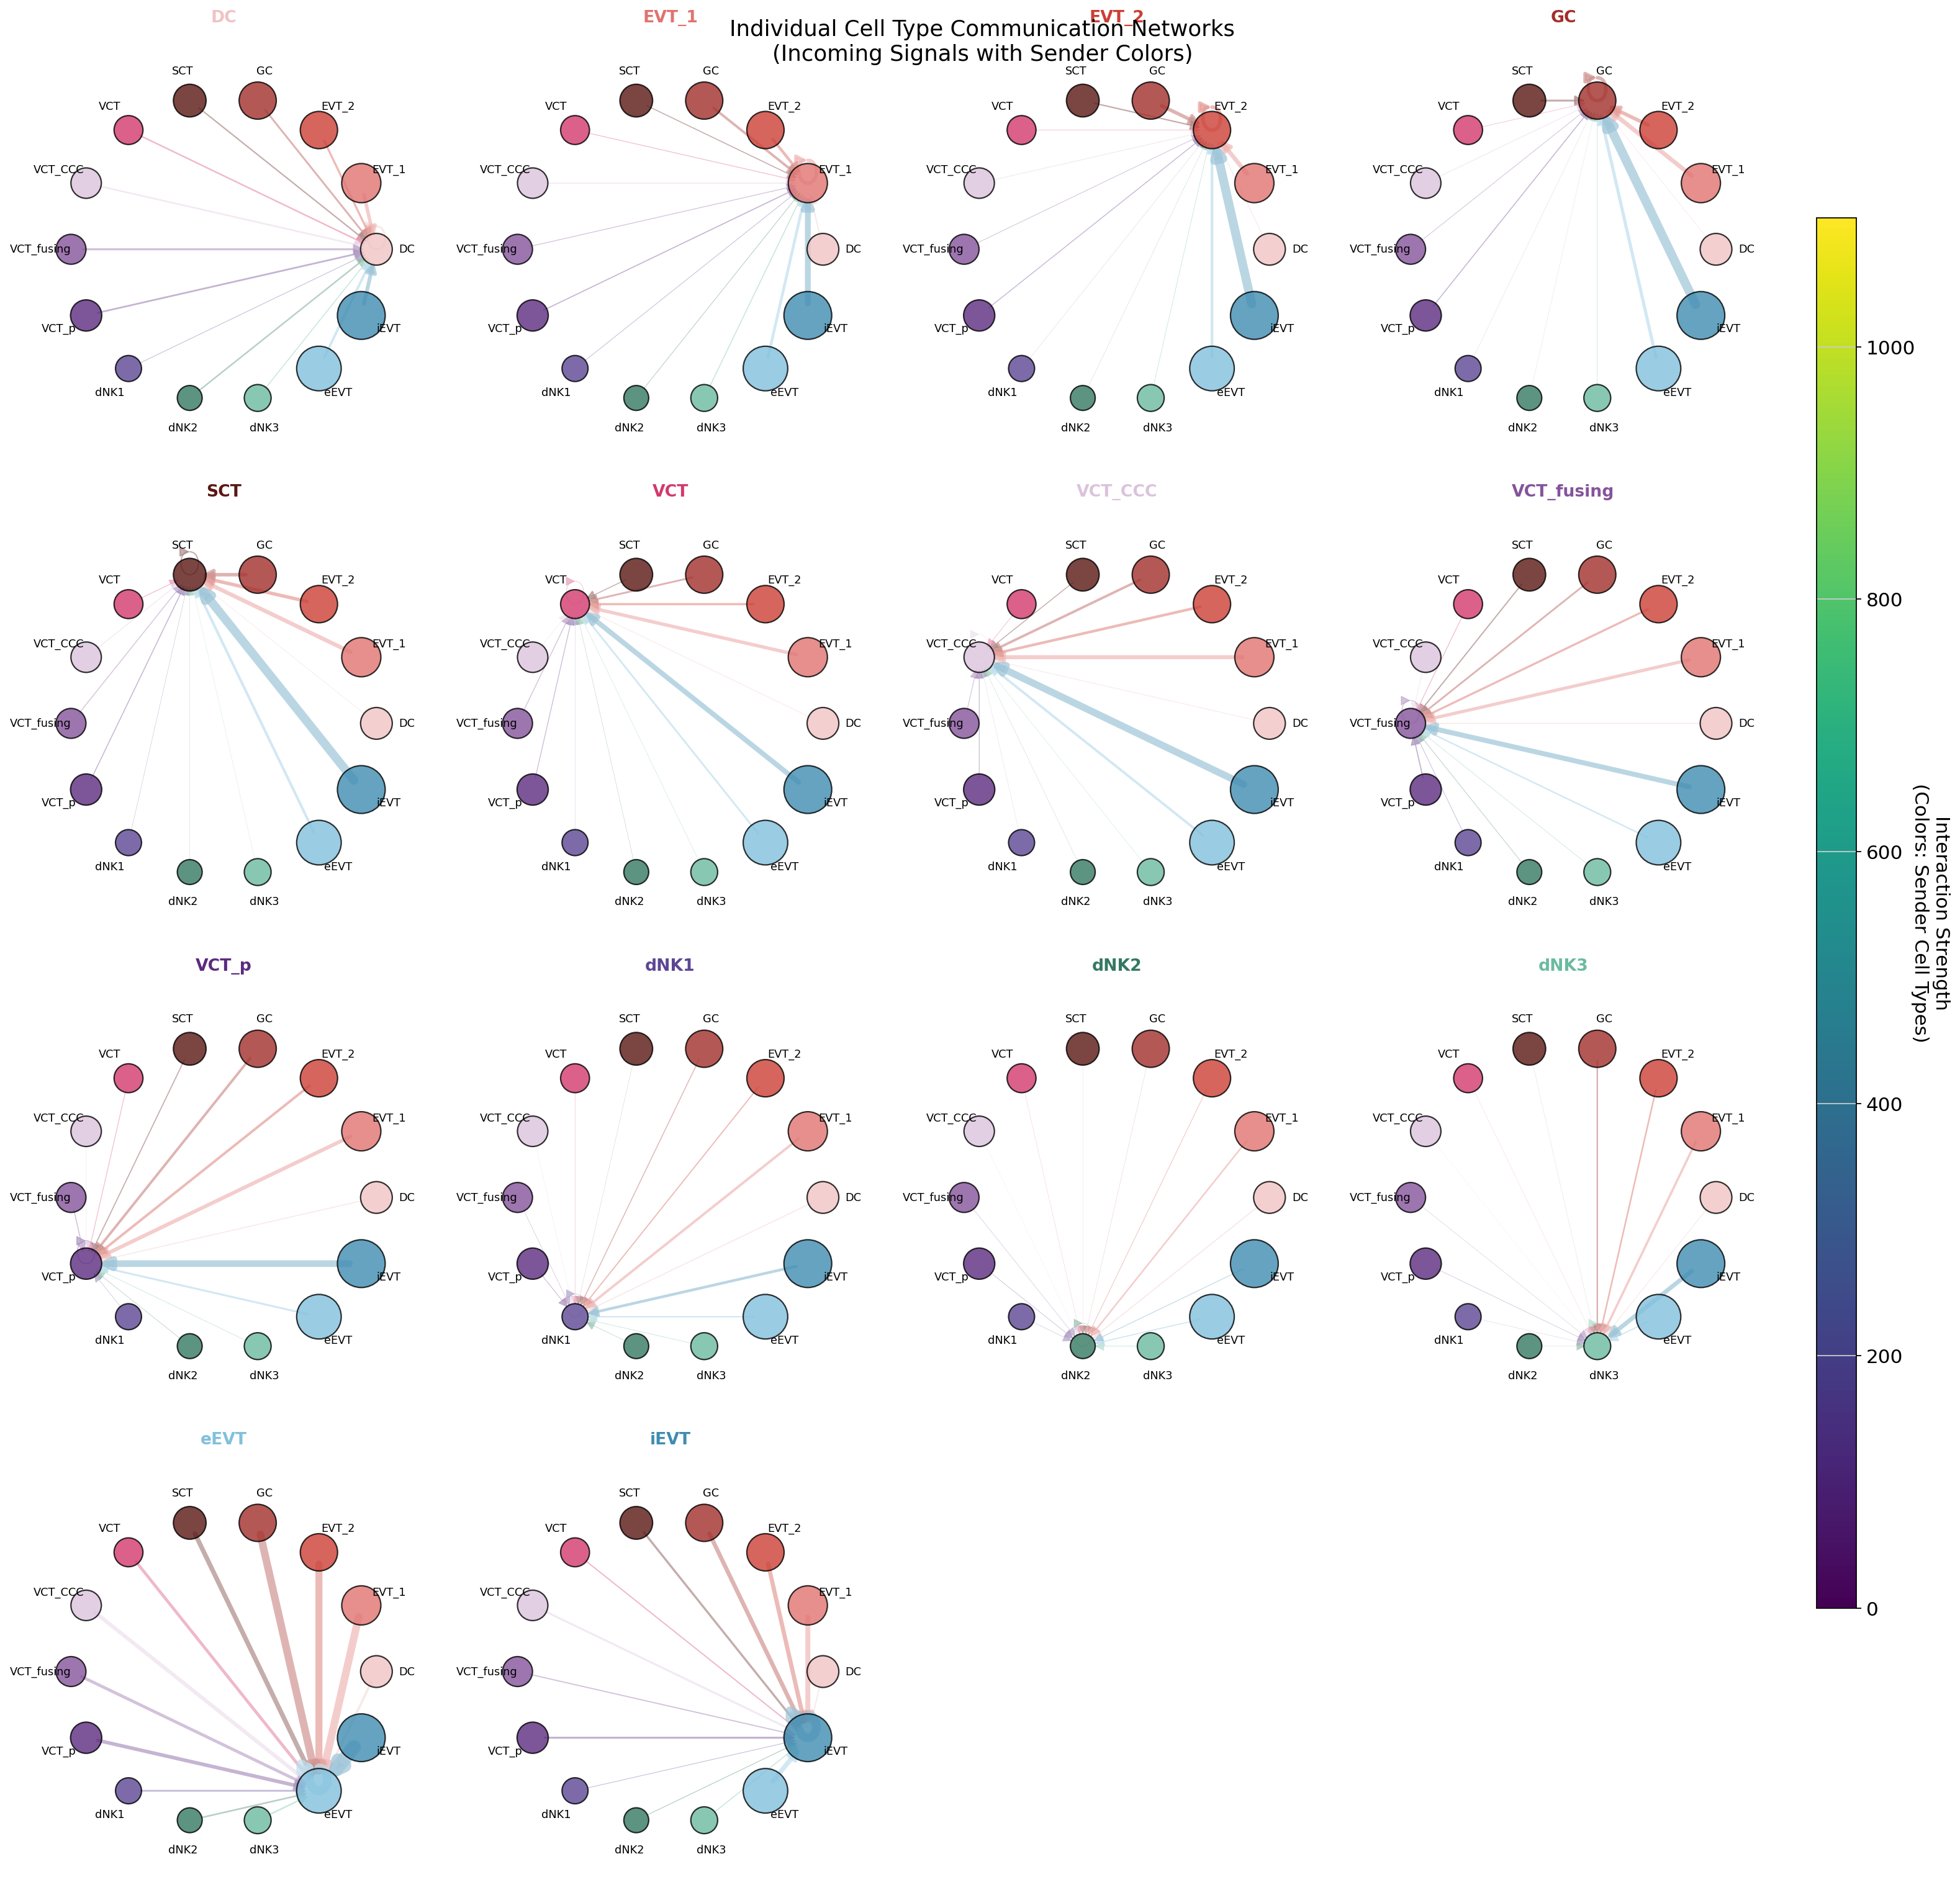
Individual Circle Plots for Outgoing and Incoming Signals
Due to the complexity of cell-cell communication networks, we can examine signaling patterns from different perspectives:
Outgoing signals: Shows which cell types are the most active senders of communication signals
Incoming signals: Reveals which cell types are the most active receivers of communication signals
By using netVisual_individual_circle, we can compare edge weights between different networks while maintaining consistent scaling parameters. This approach is particularly useful for identifying cell types that serve as communication hubs in your system.
# 绘制所有细胞类型的向外信号(类似CellChat功能)
fig = viz.netVisual_individual_circle(
    pvalue_threshold=0.05,
    vertex_size_max=10,
    edge_width_max=10,  # 保持一致以便比较
    show_labels=True,
    cmap='Blues',
    figsize=(20, 20),
    ncols=4,
    #vertex_size_max=10,
)
# 绘制接收信号
fig = viz.netVisual_individual_circle_incoming(
    pvalue_threshold=0.05,
    cmap='Reds',
    figsize=(20, 20),
    ncols=4,
    vertex_size_max=10,
)
Visualize each signaling pathway using Hierarchy plot, Circle plot or Chord diagram
Part I: Identify signaling pathways showing significant communications
Now we turn to pathway-level analysis. CellPhoneDB organizes ligand-receptor pairs into functional pathways based on their biological roles. We can identify the most significant signaling pathways by computing pathway-level communication strength.
Pathway Significance Analysis
The analysis involves:
Pathway aggregation: Group L-R pairs by functional classification
Strength calculation: Compute total communication strength per pathway
Significance assessment: Identify pathways with strong and statistically significant communications
This approach helps focus downstream analysis on the most biologically relevant signaling systems.
pathway_comm = viz.compute_pathway_communication(
  method='mean',           # 对通路内L-R对取平均
  min_lr_pairs=2,         # 通路至少包含2个L-R对
  min_expression=0.1      # 过滤低表达交互
)
# 方法2:基于通路强度判断显著通路
sig_pathways, summary = viz.get_significant_pathways_v2(
  pathway_comm,
  strength_threshold=0.5,    # 通路平均强度阈值
  pvalue_threshold=0.05,     # 个别L-R对的p-value阈值
  min_significant_pairs=1    # 至少1对细胞显著
)
🔬 Calculating cell communication strength for 121 pathways...
- Aggregation method: mean
- Minimum expression threshold: 0.1
✅ Completed pathway communication strength calculation for 107 pathways
📊 Pathway significance analysis results:
- Total pathways: 107
- Significant pathways: 69
- Strength threshold: 0.5
- p-value threshold: 0.05
🏆 Top 10 pathways by total strength:
----------------------------------------------------------------------------------------------------
Pathway Total Max Mean L-R Active Sig Rate Status
----------------------------------------------------------------------------------------------------
Adhesion by Fibronectin 4488.87 145.91 22.90 12 196 52 0.27 ***
Signaling by Annexin 885.09 26.18 6.32 2 140 7 0.05 ***
Signaling by Placenta growth 829.15 21.65 5.06 4 164 59 0.36 ***
Signaling by Teneurin 734.99 10.64 4.15 12 177 42 0.24 ***
Signaling by Amyloid-beta pr 613.11 26.05 3.18 5 193 62 0.32 ***
Signaling by Steroids 504.07 38.99 3.17 10 159 10 0.06 ***
Signaling by Galectin 446.87 11.45 2.39 4 187 45 0.24 ***
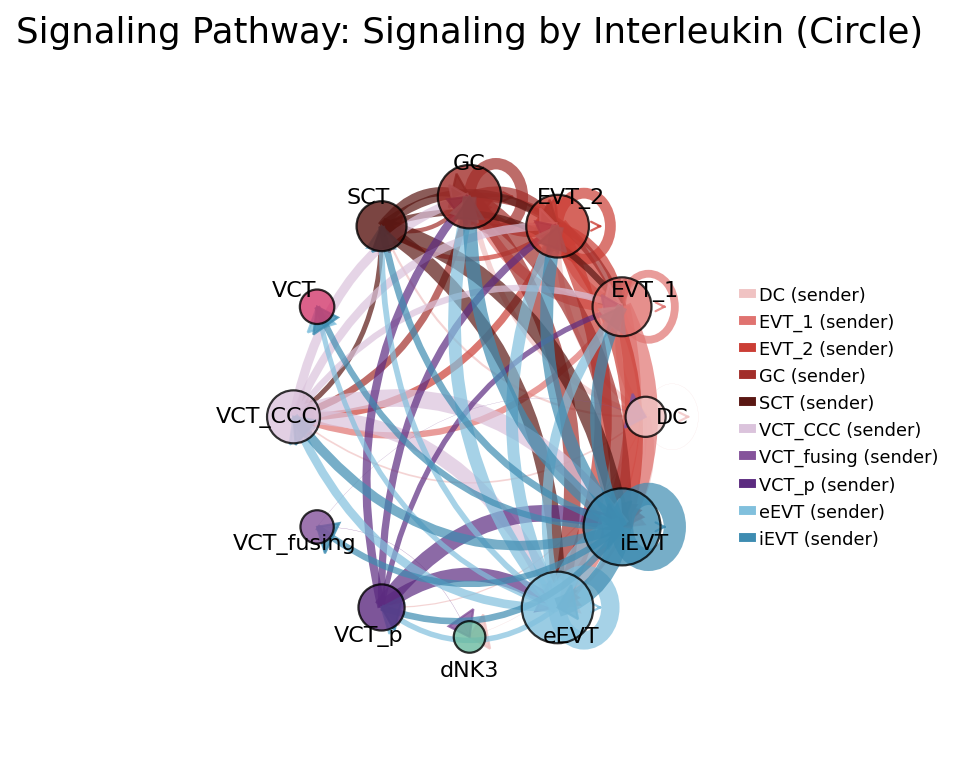
Signaling by Interleukin 436.29 15.95 2.41 14 181 61 0.34 ***
Signaling by Vascular endoth 410.57 10.17 2.32 12 177 61 0.34 ***
Signaling by Insulin-like gr 398.46 18.64 2.03 6 196 48 0.24 ***
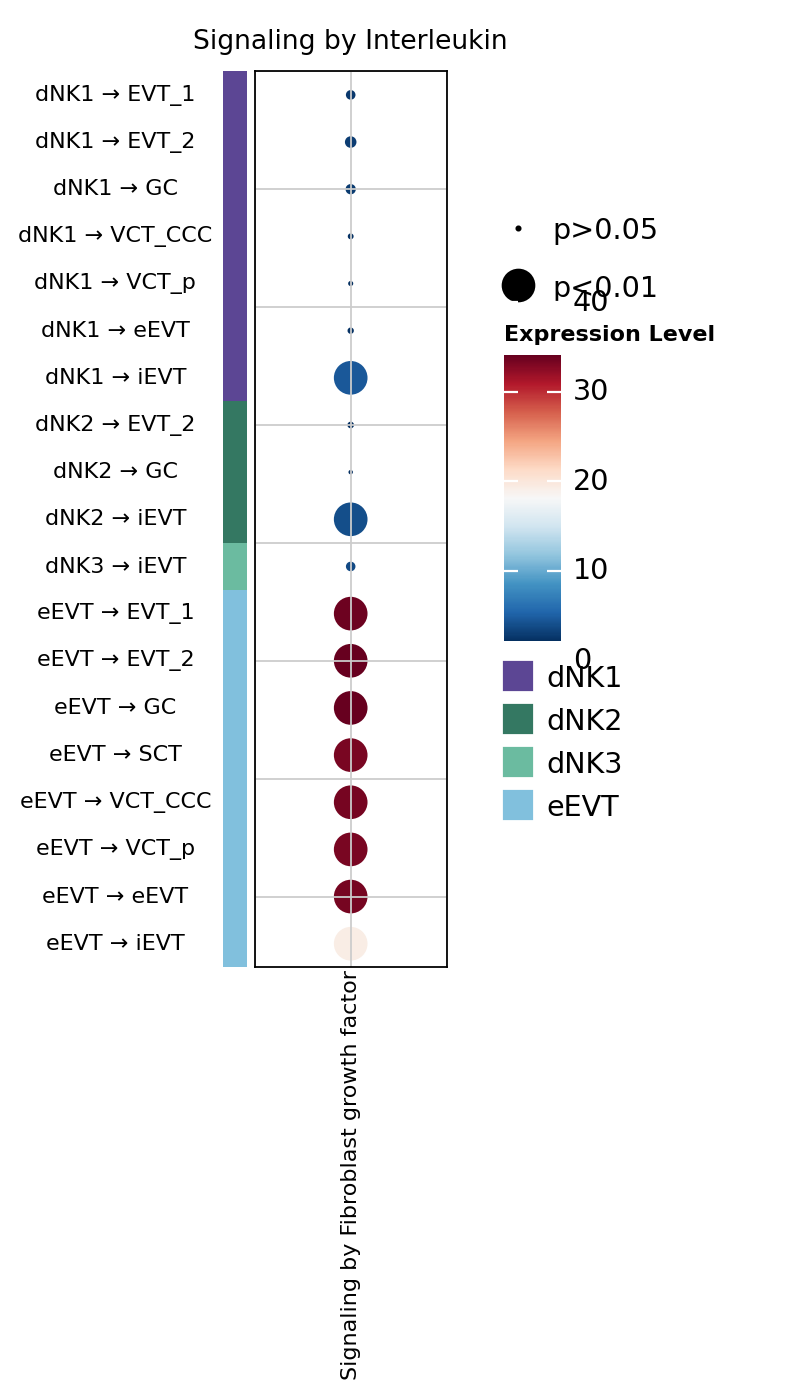
# 2. 绘制特定通路的圆形图
pathways_show = ["Signaling by Interleukin"]  # 或者从上面获取的列表中选择
fig, ax = viz.netVisual_aggregate(
    signaling=pathways_show,
    layout="circle",
    figsize=(5, 5),
    vertex_size_max=10,
)
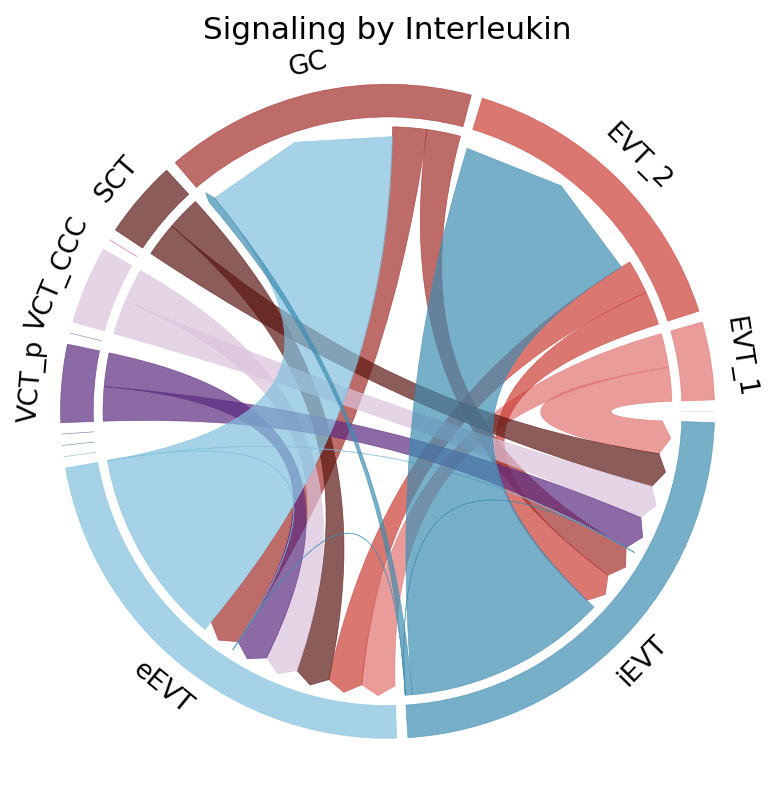
fig, ax = viz.netVisual_chord_cell(
    signaling=pathways_show[0],
    group_celltype=None,
    count_min=10,
    figsize=(5,5),
    normalize_to_sender=True
)
ax.set_title(pathways_show[0])
fig.show()
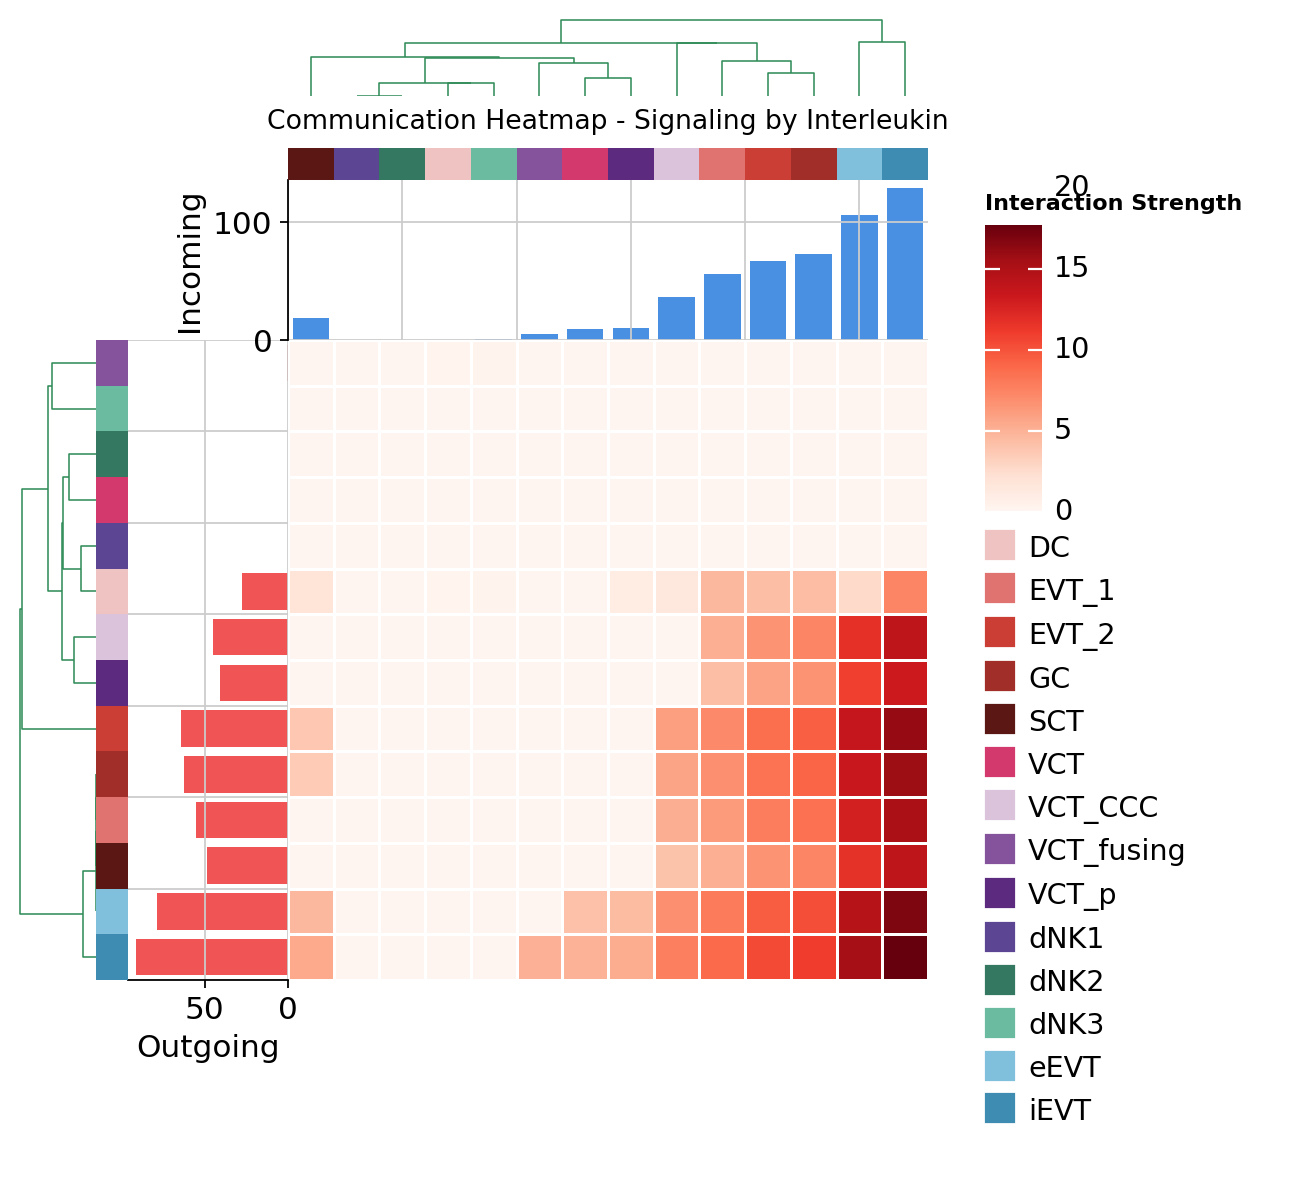
h = viz.netVisual_heatmap_marsilea(
    signaling=pathways_show,      # 指定信号通路
    color_heatmap="Reds",        # CellChat的color.heatmap参数
    add_dendrogram=True,
    #title="CXCL Signaling Heatmap"
)
h.render()
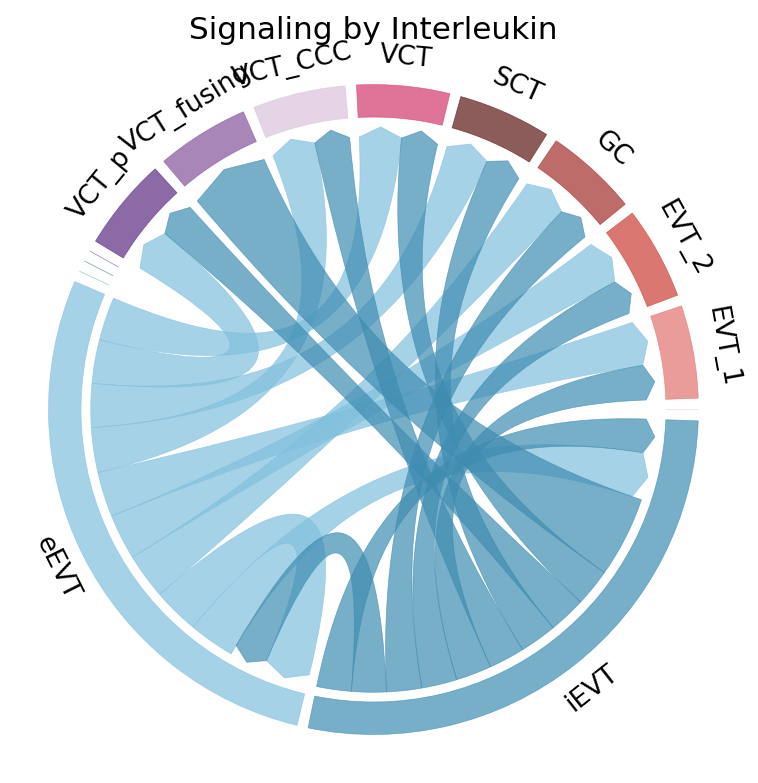
fig, ax = viz.netVisual_chord_cell(
    signaling=pathways_show[0],
    group_celltype=None,
    count_min=0,
    figsize=(5,5),
    sources=['eEVT','iEVT',],
    normalize_to_sender=True
)
ax.set_title(pathways_show[0])
fig.show()
Part II: Identify ligand-receptor pairs contributing to signaling pathways
Once we’ve identified significant pathways, we need to understand which specific ligand-receptor pairs drive the communication within each pathway. This analysis helps:
Identify key L-R pairs: Find the most contributory interactions within pathways
Prioritize targets: Focus on the most important molecular mechanisms
Understand specificity: See which cell type pairs use specific L-R interactions
Contribution Analysis and Bubble Plots
We can visualize pathway-specific communications using:
Contribution analysis: Quantify how much each L-R pair contributes to pathway strength
Bubble plots: Show interaction patterns across cell types with statistical significance
Chord diagrams: Display specific L-R pair communications between cell types
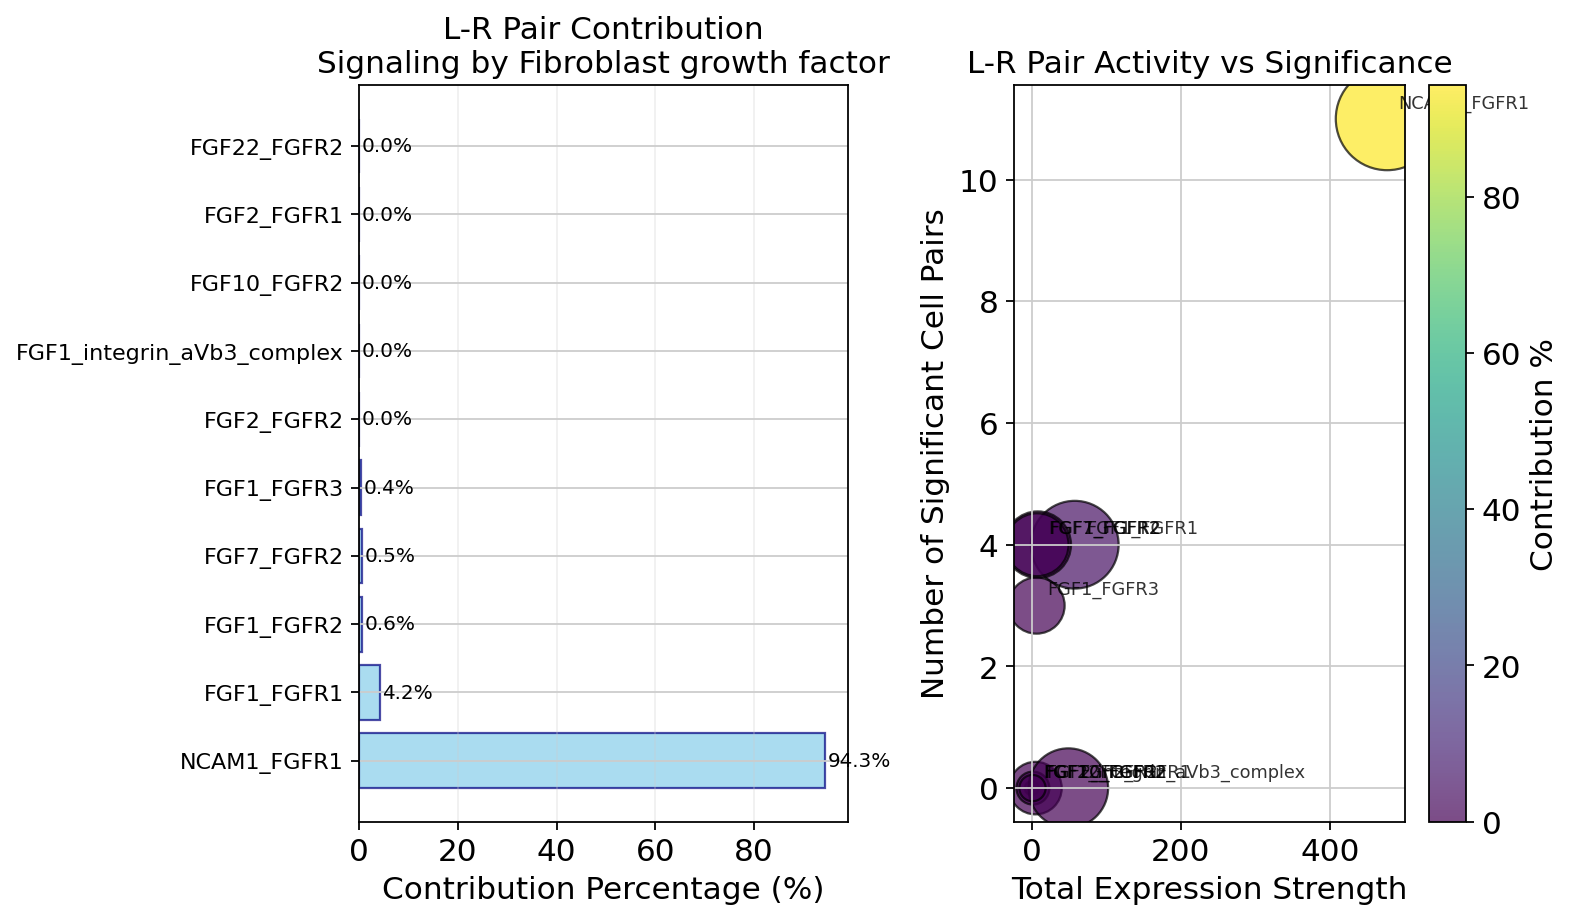
pathways = ['Signaling by Fibroblast growth factor']


enriched_lr = viz.extractEnrichedLR(pathways)
print(f"Find {len(enriched_lr)} sig L-R")


for pathway in pathways:
  contribution_df, fig, axes = viz.netAnalysis_contribution(pathway)
  print(f"{pathway} most important L-R pair: {contribution_df.iloc[0]['ligand_receptor']}")

viz.netVisual_bubble_marsilea(sources_use=None, targets_use=None,
                                 signaling=pathways, pvalue_threshold=1,
                                 mean_threshold=0.1, top_interactions=20,
                                 show_pvalue=False, show_mean=False, show_count=True,
                                 add_violin=True, add_dendrogram=True,
                                 group_pathways=True, figsize=(2, 8),
                              font_size=10,
                                 title=pathways_show[0],
                                 remove_isolate=False)
✅ Found 5 enriched L-R pairs in pathway(s): Signaling by Fibroblast growth factor
Find 5 sig L-R
Signaling by Fibroblast growth factor most important L-R pair: NCAM1_FGFR1
Warning: Insufficient data variability for clustering. Skipping dendrograms.
📊 Visualization statistics:
   - Number of significant interactions: 20
   - Number of cell type pairs: 19
   - Signaling pathways: 1
<marsilea.heatmap.SizedHeatmap at 0x7f76f694c820>
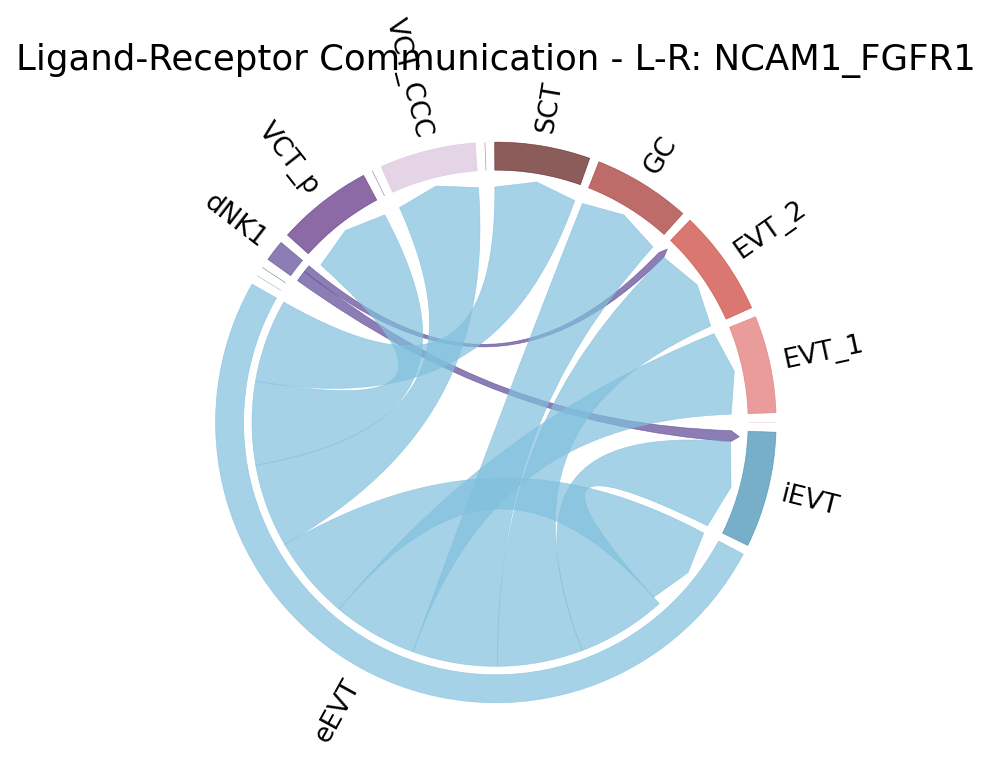
fig, ax = viz.netVisual_chord_LR(
    ligand_receptor_pairs='NCAM1_FGFR1',
    #group_celltype=None,
    count_min=1,
    figsize=(5,5),
    sources=['eEVT','dNK1',],
    rotate_names=True

    #normalize_to_sender=True
)
fig.show()
Visualize cell-cell communication mediated by multiple ligand-receptors or signaling pathways
Part III: Systems-level visualization of multiple pathways and L-R pairs
For comprehensive analysis, we often need to visualize communications across multiple pathways or compare different biological contexts. This systems-level view helps:
Cross-pathway analysis: Compare communication patterns between different signaling systems
Cell type-specific analysis: Focus on communications from specific sender cell types
Pathway integration: Understand how multiple pathways work together in cell communication
Advanced Visualization Approaches
Multi-pathway bubble plots: Compare multiple pathways side-by-side
Source-specific analysis: Focus on signals from particular cell types
Chord diagrams with gene information: Show detailed molecular interactions
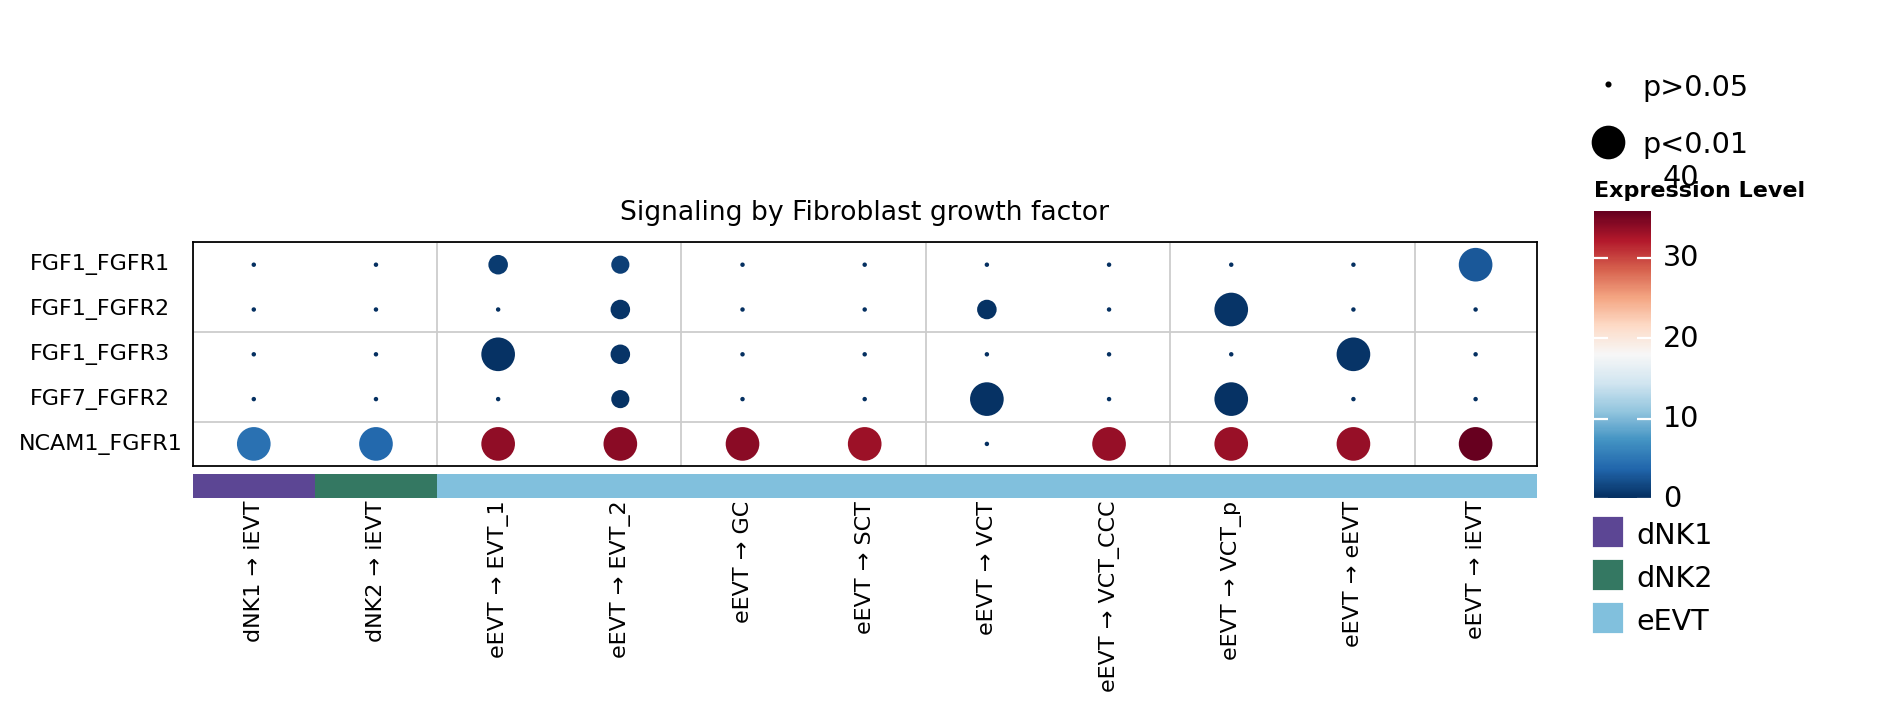
viz.netVisual_bubble_marsilea(sources_use=None,
                                 signaling=['Signaling by Fibroblast growth factor'], pvalue_threshold=0.01,
                              #show_mean=False,
                                 mean_threshold=0.1, top_interactions=200,cmap='RdBu_r',
                                 show_pvalue=False, show_mean=False, show_count=True,
                                 #add_violin=True,
                                 add_dendrogram=False,font_size=10,
                                 group_pathways=False, figsize=(14, 2),transpose=True,
                                 title="Signaling by Fibroblast growth factor",
                                 remove_isolate=False)
📊 Visualization statistics:
   - Number of significant interactions: 22
   - Number of cell type pairs: 5
   - Ligand-receptor pairs: 11
<marsilea.heatmap.SizedHeatmap at 0x7f76f64bf220>
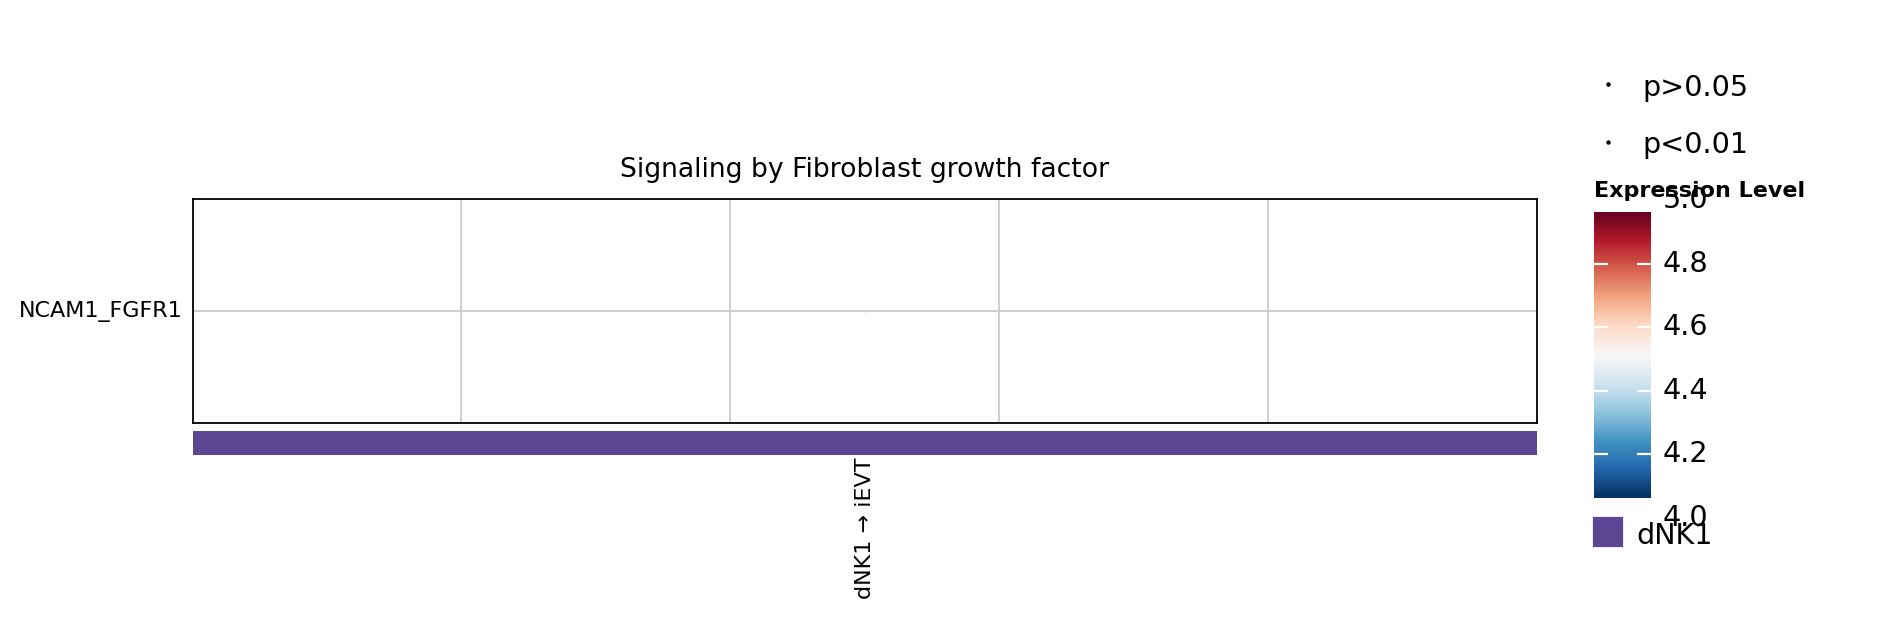
viz.netVisual_bubble_marsilea(sources_use=['dNK1'],
                                 signaling=['Signaling by Fibroblast growth factor'], pvalue_threshold=0.01,
                              #show_mean=False,
                                 mean_threshold=0.1, top_interactions=200,cmap='RdBu_r',
                                 show_pvalue=False, show_mean=False, show_count=True,
                                 #add_violin=True,
                                 add_dendrogram=False,font_size=10,
                                 group_pathways=False, figsize=(14, 2),transpose=True,
                                 title="Signaling by Fibroblast growth factor",
                                 remove_isolate=False)
⚠️  Warning: All p-values are identical. Adding slight jitter for better visualization.
⚠️  Warning: All p-values are identical after jittering. Using medium size.
📊 Visualization statistics:
   - Number of significant interactions: 1
   - Number of cell type pairs: 1
   - Ligand-receptor pairs: 1
<marsilea.heatmap.SizedHeatmap at 0x7f76f7041f00>
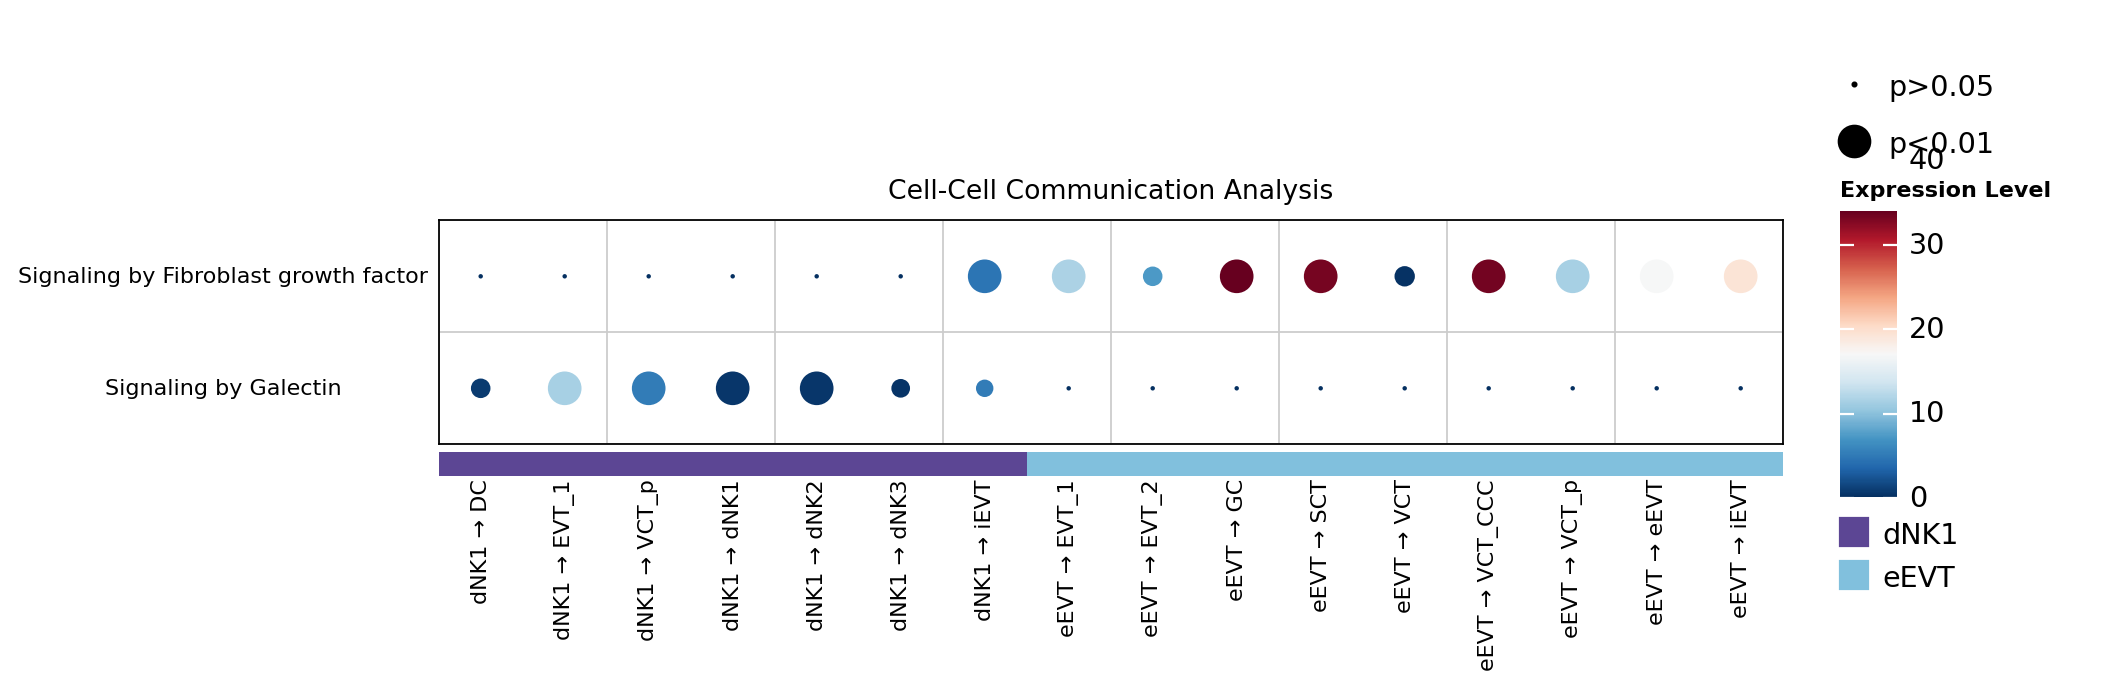
viz.netVisual_bubble_marsilea(sources_use=['eEVT','dNK1'],
                                 signaling=['Signaling by Fibroblast growth factor',
                                           'Signaling by Galectin'], pvalue_threshold=0.01,
                              #show_mean=False,
                                 mean_threshold=0.1, top_interactions=200,cmap='RdBu_r',
                                 show_pvalue=False, show_mean=False, show_count=True,
                                 #add_violin=True,
                                 add_dendrogram=False,font_size=10,
                                 group_pathways=True, figsize=(14, 2),transpose=True,
                                 title="Cell-Cell Communication Analysis",
                                 remove_isolate=False)
📊 Visualization statistics:
   - Number of significant interactions: 28
   - Number of cell type pairs: 2
   - Signaling pathways: 16
<marsilea.heatmap.SizedHeatmap at 0x7f7710a44670>
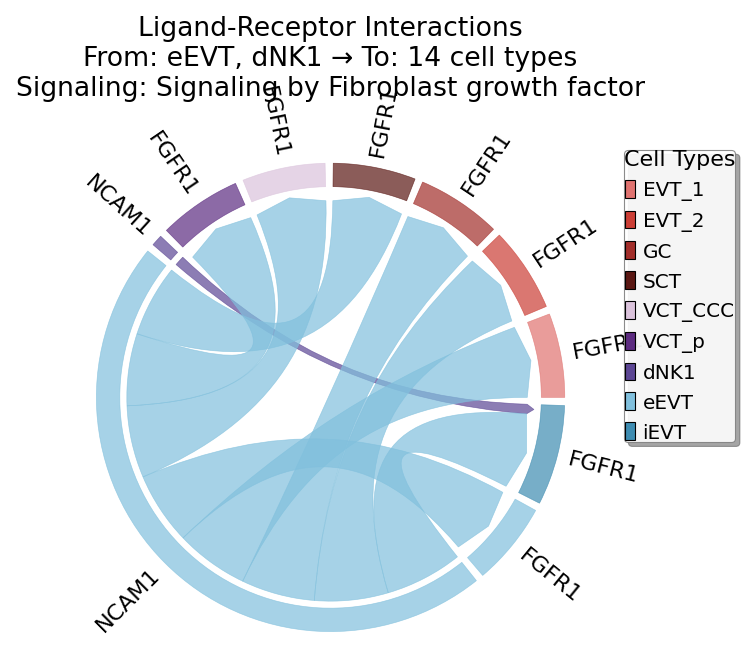
viz.netVisual_chord_gene(sources_use=['eEVT','dNK1'], targets_use=None,
                     signaling=['Signaling by Fibroblast growth factor'],
                            pvalue_threshold=0.001, mean_threshold=4,
                            gap=0.03, use_gradient=True, sort="size",
                            directed=True, chord_colors=None,
                            rotate_names=True, fontcolor="black", fontsize=10,
                            start_at=0, extent=360, min_chord_width=0,
                            ax=None, figsize=(4, 4), show_celltype_in_name=False,
                            title_name=None, save=None)
(<Figure size 320x320 with 1 Axes>,
 <Axes: title={'center': 'Ligand-Receptor Interactions\nFrom: eEVT, dNK1 → To: 14 cell types\nSignaling: Signaling by Fibroblast growth factor'}>)
centrality_scores = viz.netAnalysis_computeCentrality()
viz.netAnalysis_signalingRole_network_marsilea(signaling=None, measures=None,
                                                  color_heatmap="Greens",
                                                  width=8, height=2, font_size=10,
                                                  title="EVT: Signaling Role Analysis",
                                                  add_dendrogram=False, add_cell_colors=True,
                                                  add_importance_bars=False, show_values=False,
                                                  save=None)
✅ Network centrality calculation completed (CellChat-style Importance values)
   - Signaling pathways used: All pathways
   - Weight mode: Weighted
   - Calculated metrics: outdegree, indegree, flow_betweenness, information, overall
   - All centrality scores normalized to 0-1 range (Importance values)
📊 信号角色分析结果(Marsilea可视化,Importance值 0-1):
   - Dominant Sender: iEVT (Importance: 1.000)
   - Dominant Receiver: eEVT (Importance: 1.000)
   - Mediator: dNK2 (Importance: 1.000)
   - Influencer: iEVT (Importance: 1.000)
<marsilea.heatmap.Heatmap at 0x7f771045d720>
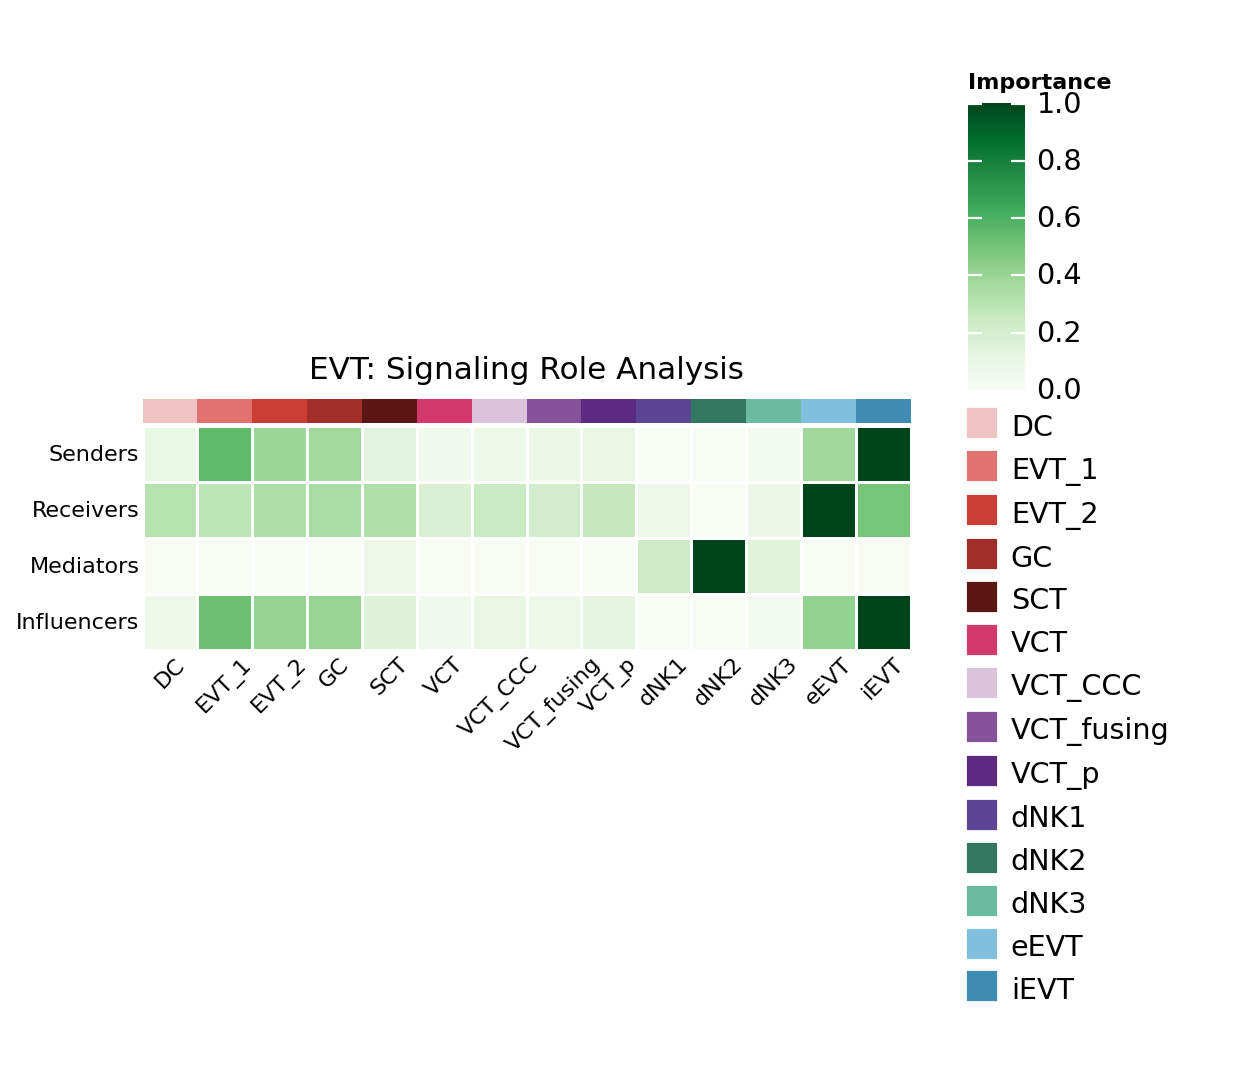
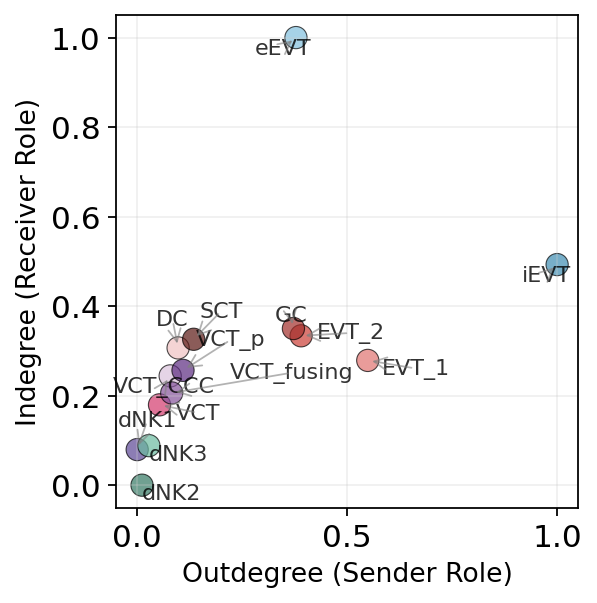
fig3, ax3 = viz.netAnalysis_signalingRole_scatter(
    signaling=None,
    x_measure='outdegree',
    y_measure='indegree',
    title="",
    figsize=(4,4)
)
viz.netAnalysis_signalingRole_network_marsilea(signaling=['Signaling by Fibroblast growth factor'], measures=None,
                                                  color_heatmap="Greens",
                                                  width=8, height=2, font_size=10,
                                                  title="Signaling by Fibroblast growth factor",
                                                  add_dendrogram=False, add_cell_colors=True,
                                                  add_importance_bars=False, show_values=False,
                                                  save=None)
✅ Network centrality calculation completed (CellChat-style Importance values)
   - Signaling pathways used: ['Signaling by Fibroblast growth factor']
   - Weight mode: Weighted
   - Calculated metrics: outdegree, indegree, flow_betweenness, information, overall
   - All centrality scores normalized to 0-1 range (Importance values)
📊 信号角色分析结果(Marsilea可视化,Importance值 0-1):
   - Dominant Sender: eEVT (Importance: 1.000)
   - Dominant Receiver: iEVT (Importance: 1.000)
   - Influencer: eEVT (Importance: 1.000)
<marsilea.heatmap.Heatmap at 0x7f771045da50>
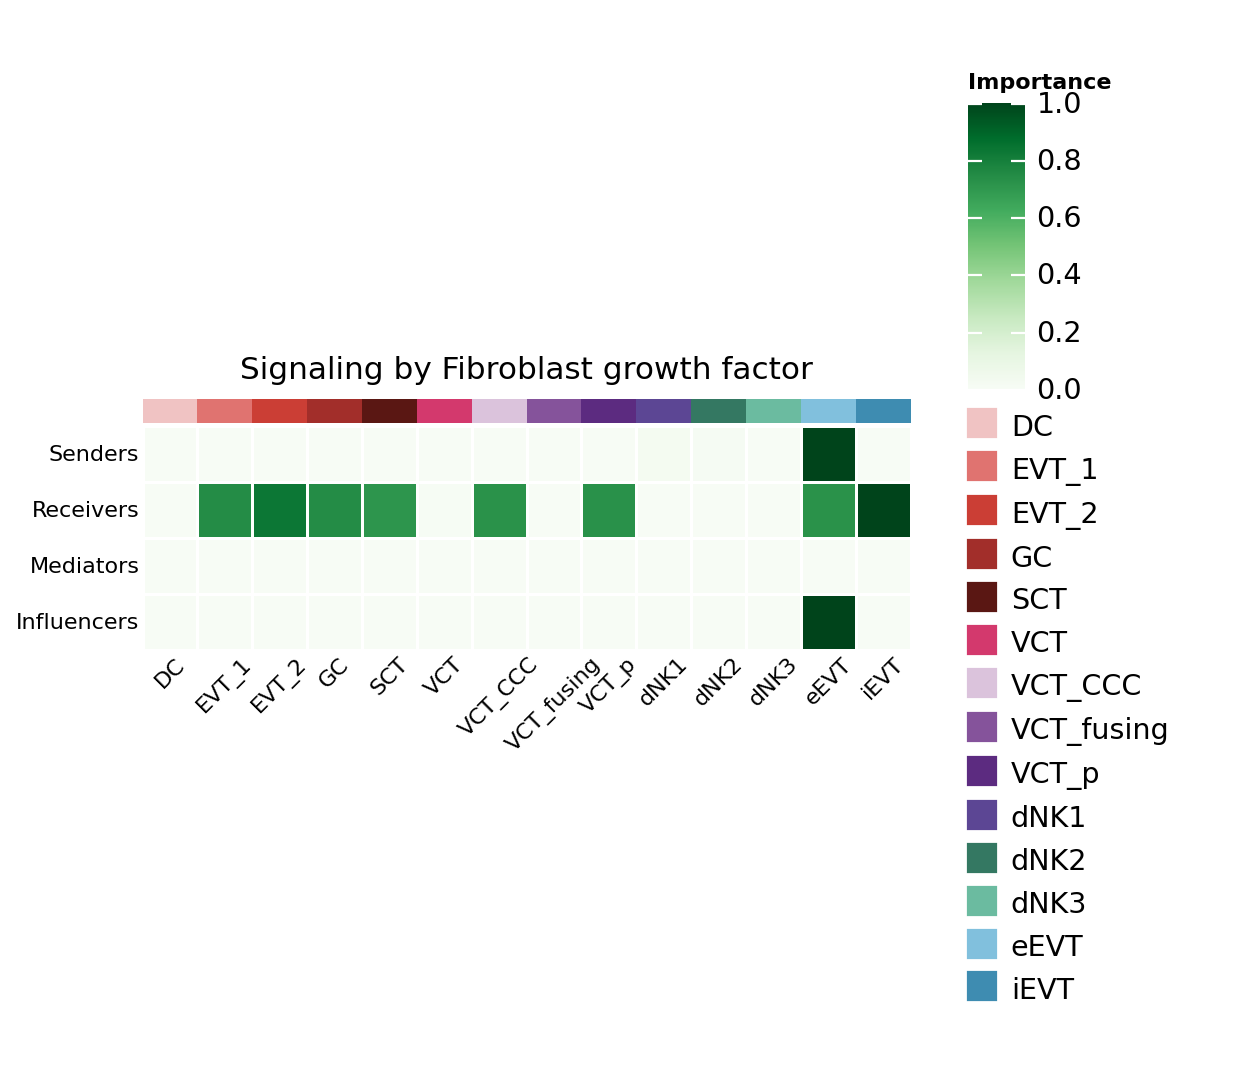
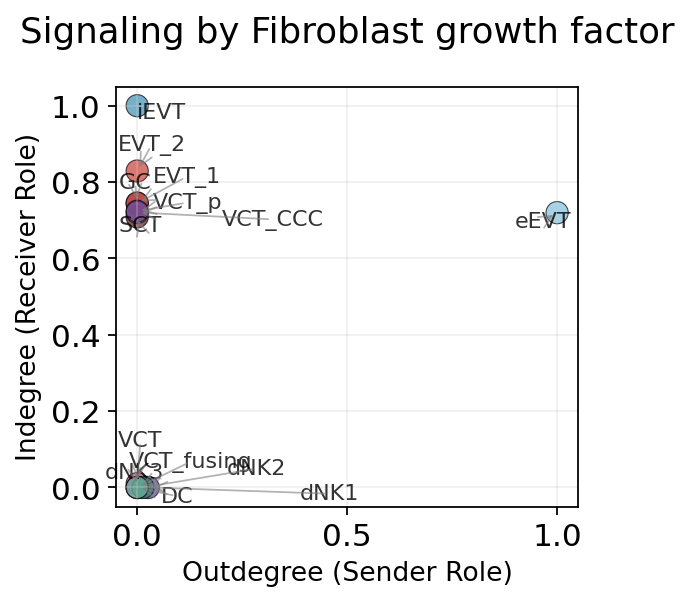
fig3, ax3 = viz.netAnalysis_signalingRole_scatter(
    signaling=['Signaling by Fibroblast growth factor'],
    x_measure='outdegree',
    y_measure='indegree',
    title="Signaling by Fibroblast growth factor",
    figsize=(4,4)
)
✅ Network centrality calculation completed (CellChat-style Importance values)
   - Signaling pathways used: ['Signaling by Fibroblast growth factor']
   - Weight mode: Weighted
   - Calculated metrics: outdegree, indegree, flow_betweenness, information, overall
   - All centrality scores normalized to 0-1 range (Importance values)
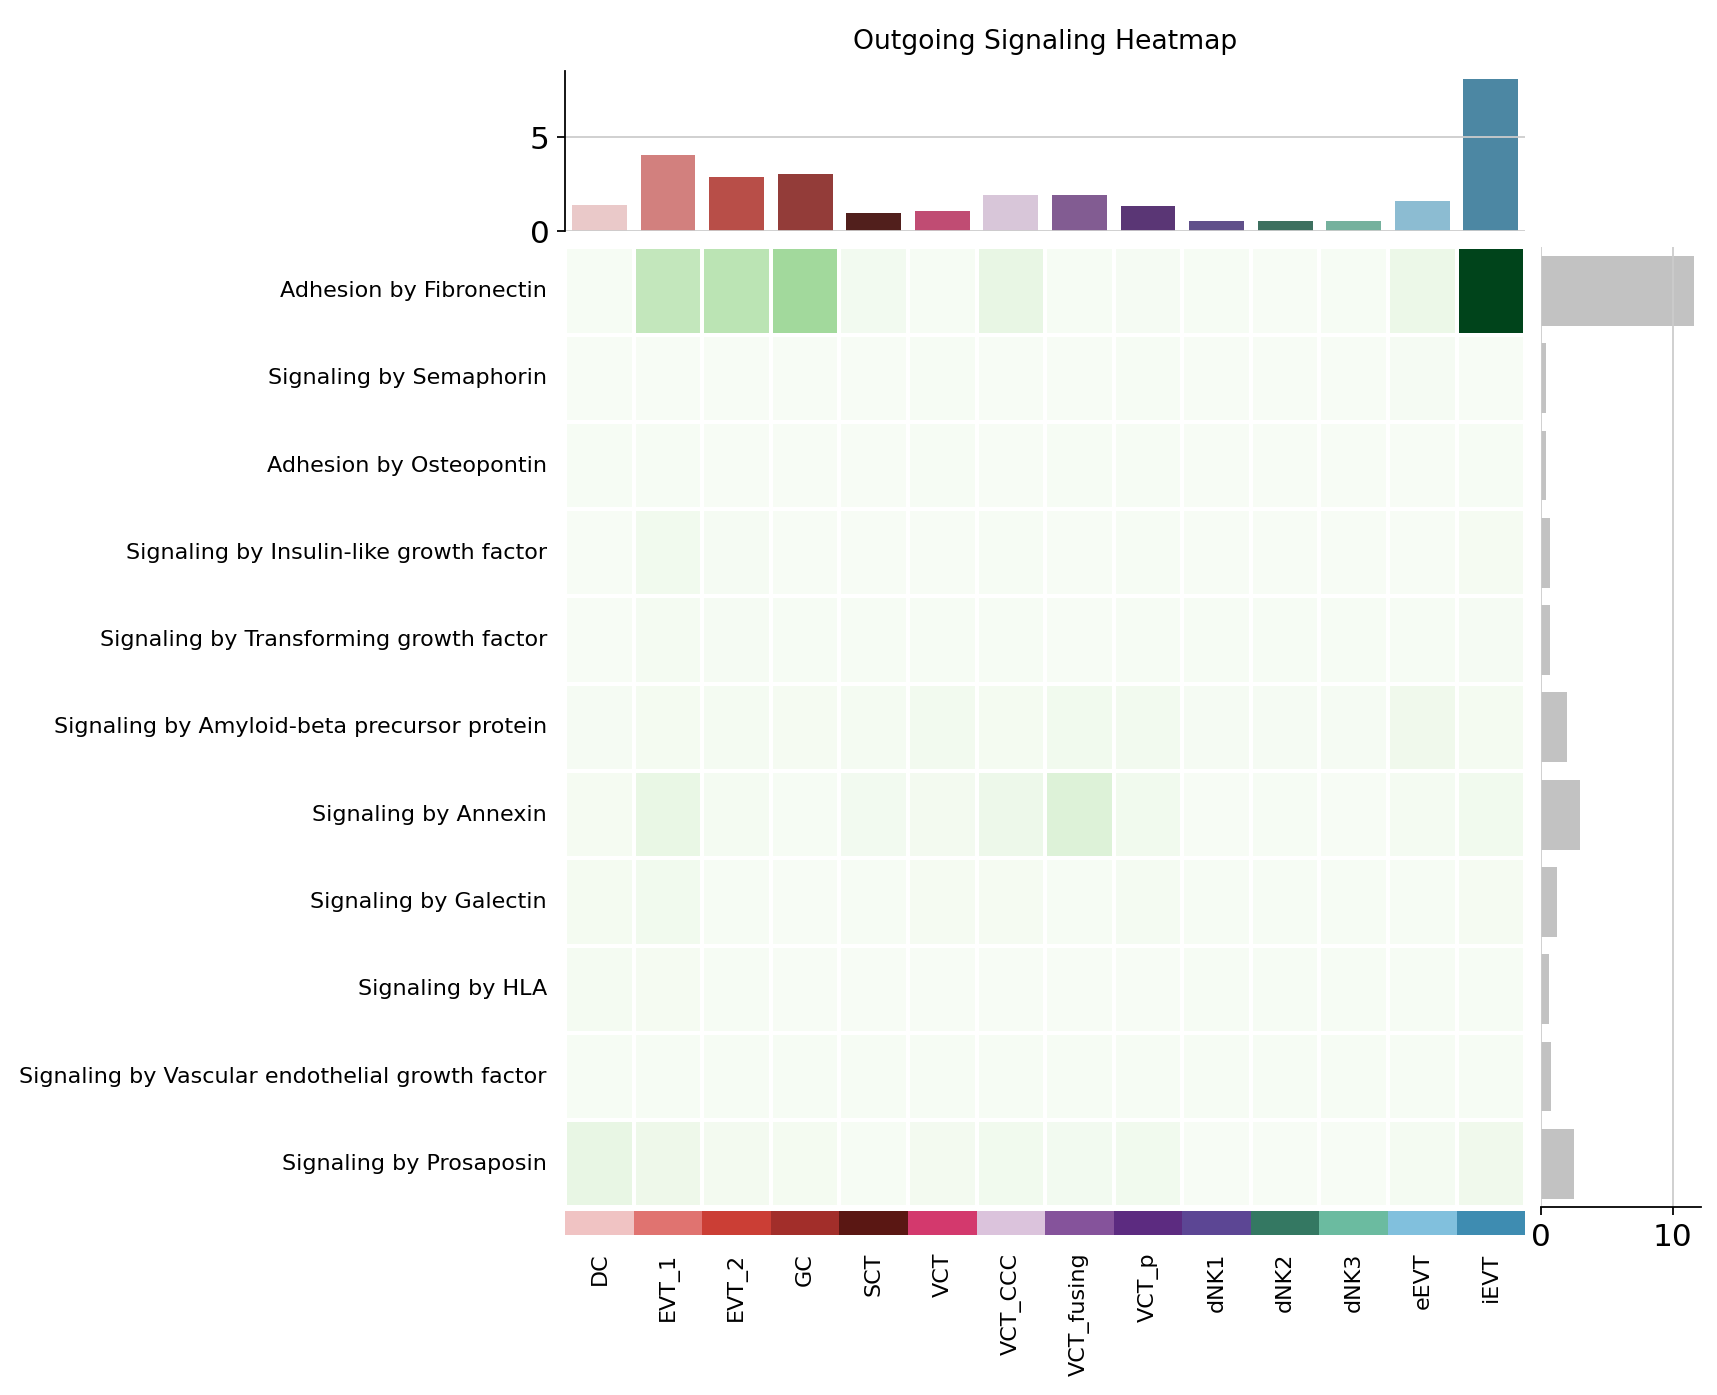
res=viz.netAnalysis_signalingRole_heatmap(pattern="outgoing", signaling=None,
                                        row_scale=False, figsize=(6, 6),
                                        cmap='Greens', show_totals=True,
                                        title=None, save=None)
📊 Heatmap statistics:
   - Number of pathways: 11
   - Number of cell types: 14
   - Signal strength range: 0.103 - 73.498
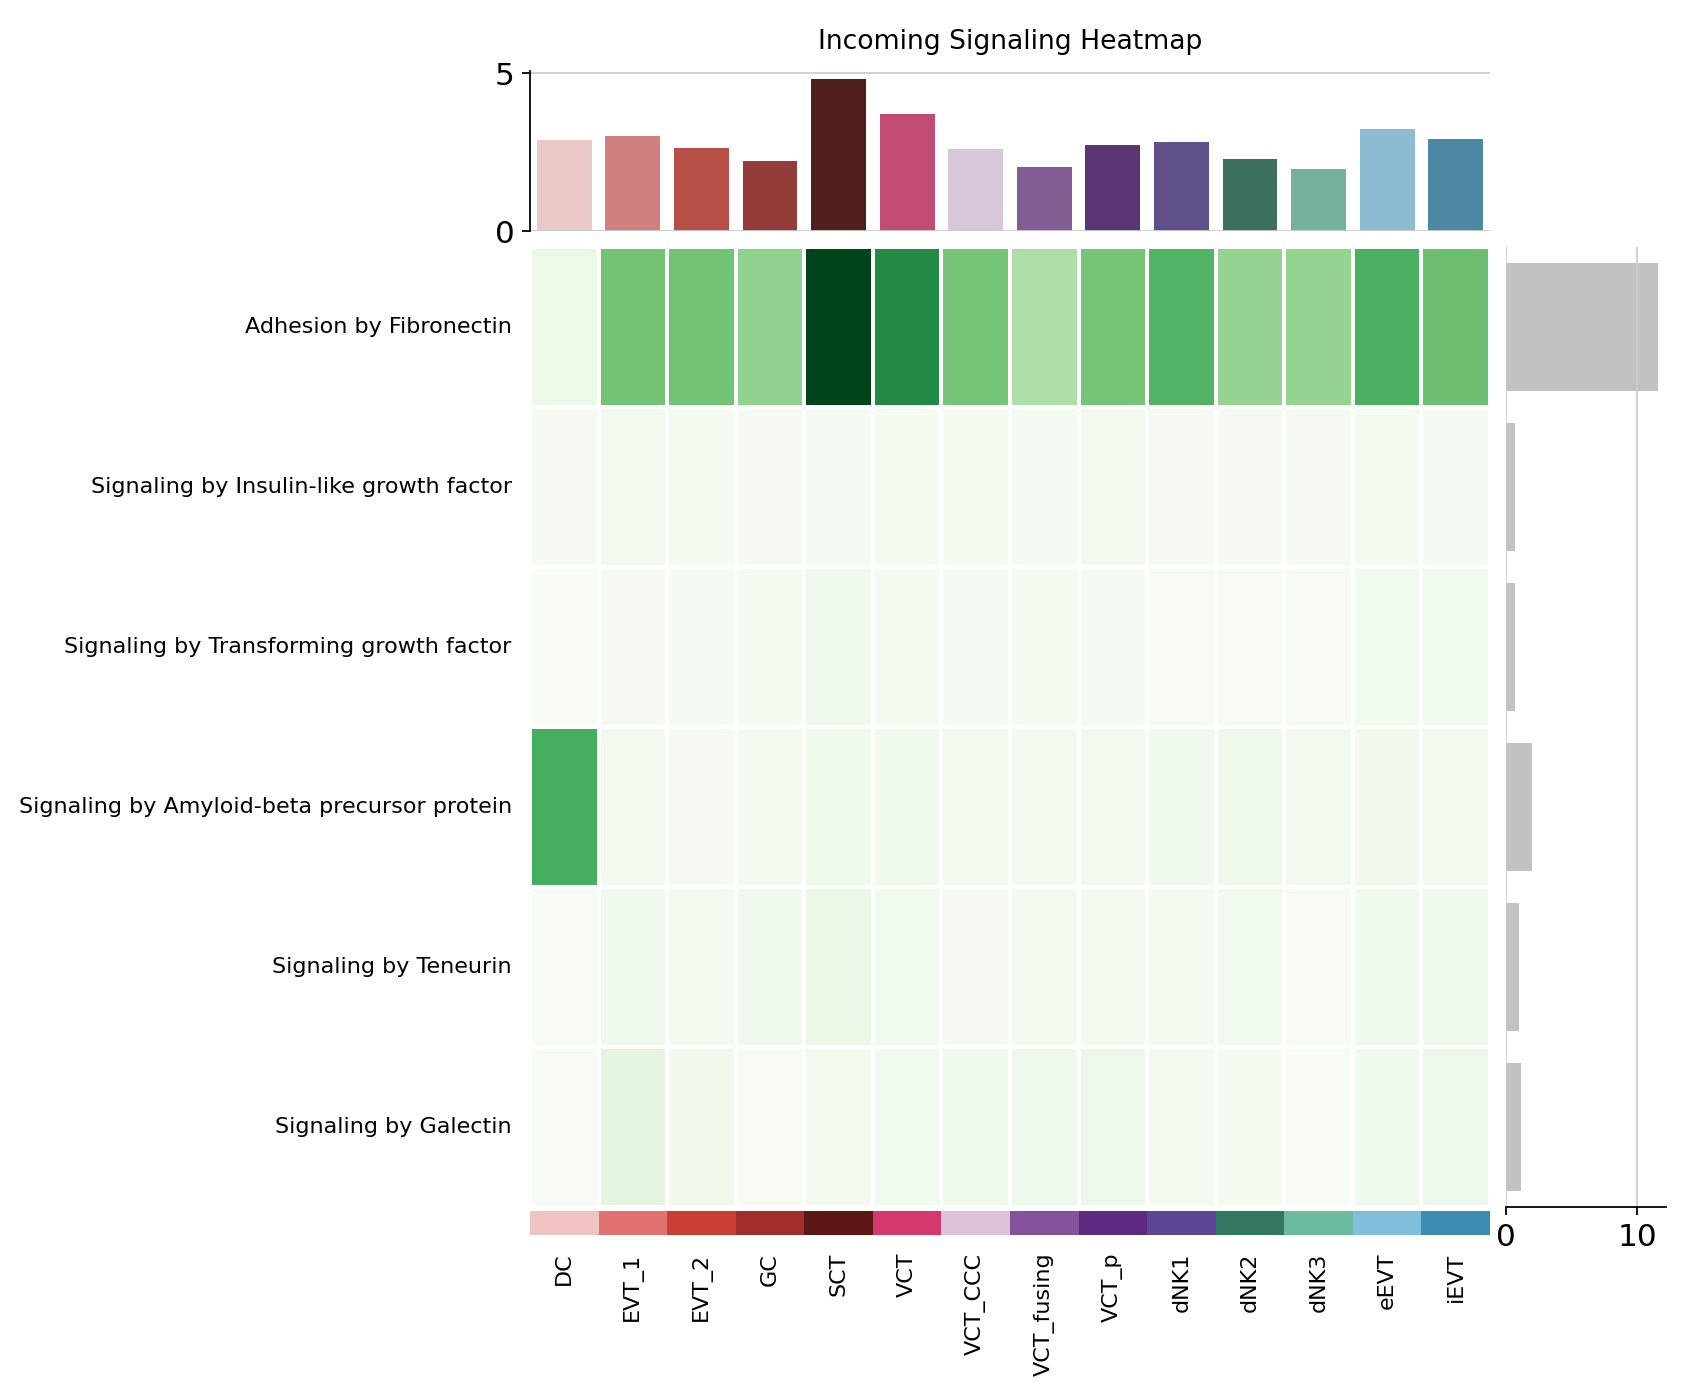
res=viz.netAnalysis_signalingRole_heatmap(pattern="incoming", signaling=None,
                                        row_scale=False, figsize=(6, 6),
                                        cmap='Greens', show_totals=True,
                                        title=None, save=None)
📊 Heatmap statistics:
   - Number of pathways: 6
   - Number of cell types: 14
   - Signal strength range: 0.165 - 22.650
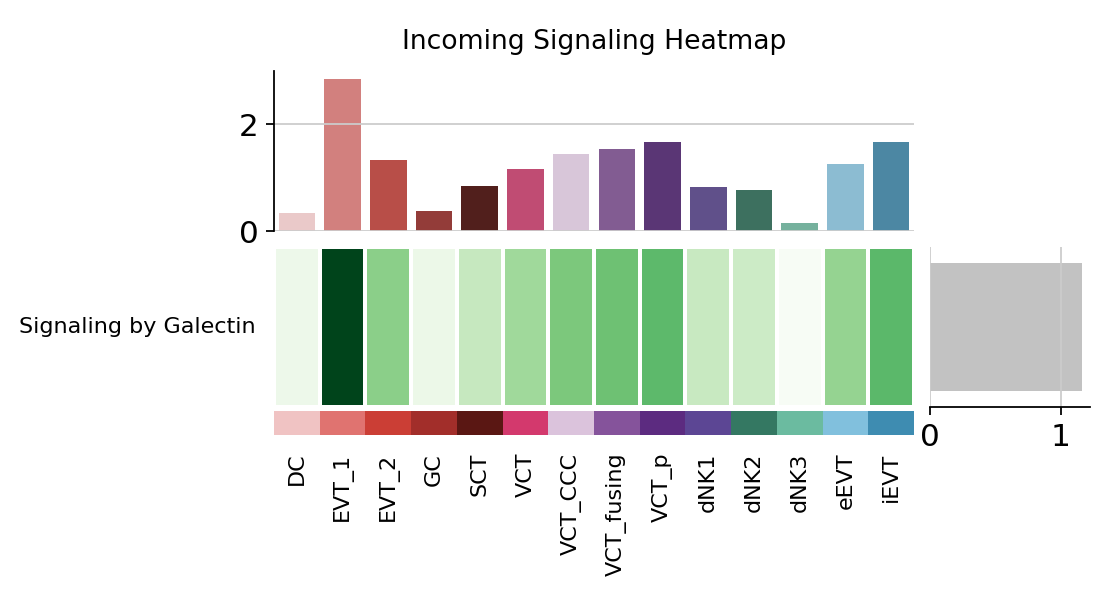
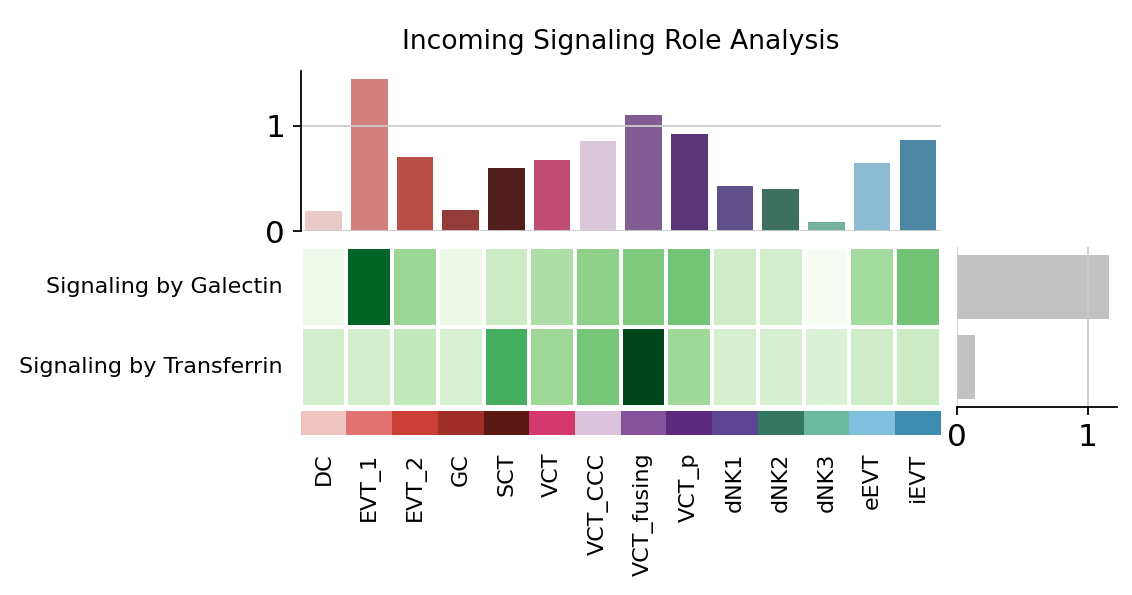
res=viz.netAnalysis_signalingRole_heatmap(pattern="incoming",
                                          signaling=['Signaling by Galectin','Signaling by Transferrin'],
                                        row_scale=True, figsize=(4, 1),
                                        cmap='Greens', show_totals=True,
                                        title=None, save=None)
📊 Heatmap statistics:
   - Number of pathways: 1
   - Number of cell types: 14
   - Signal strength range: 0.165 - 2.851
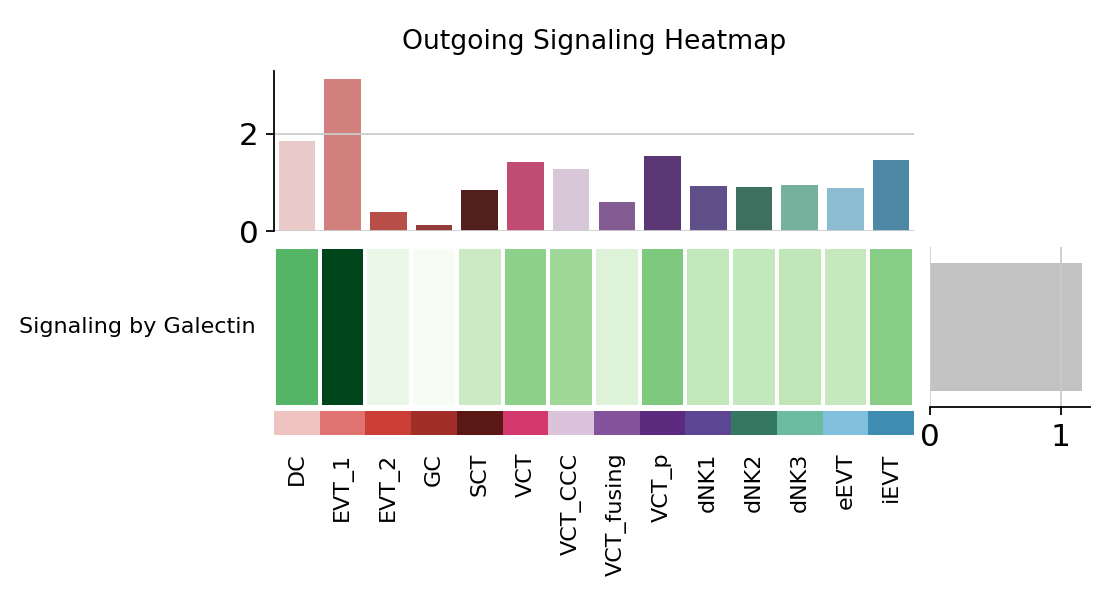
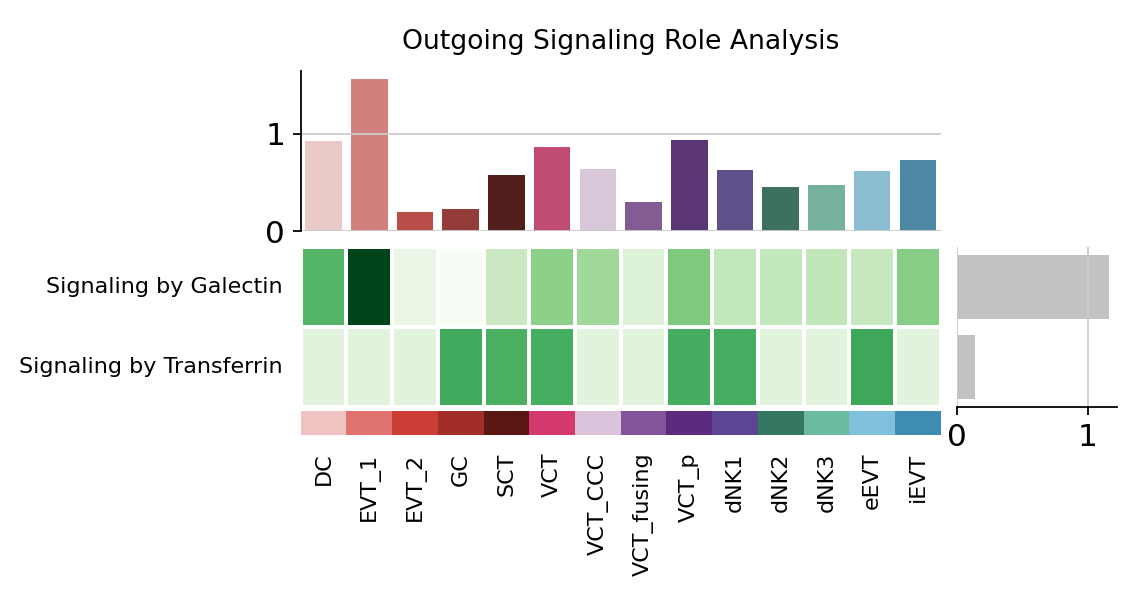
res=viz.netAnalysis_signalingRole_heatmap(pattern="outgoing",
                                          signaling=['Signaling by Galectin','Signaling by Transferrin'],
                                        row_scale=True, figsize=(4, 1),
                                        cmap='Greens', show_totals=True,
                                        title=None, save=None)
📊 Heatmap statistics:
   - Number of pathways: 1
   - Number of cell types: 14
   - Signal strength range: 0.132 - 3.115